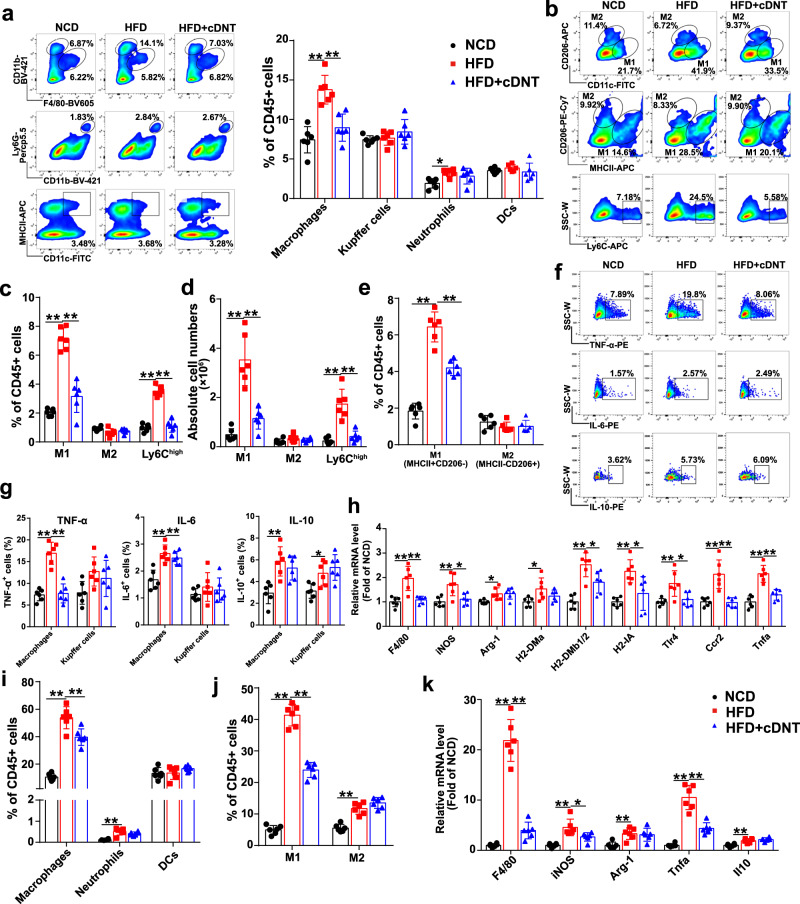
Fig. 3. Transferred cDNT inhibited the proportion of infiltrating macrophages, especially M1 macrophages, and the secretion of TNF-α in liver and adipose tissue.
a Representative flow cytometry plots (left) and statistical analysis (right) of macrophages, Kupffer cells, neutrophils, and DCs relative to the total intrahepatic CD45.2+ cells in mice. NCD, black; HFD, red; HFD + cDNT, blue. Actual p values (left → right): 0.000038, 0.00065, 0.013. b Flow cytometric images of M1 and M2 macrophages and Ly6Chigh cells. c Statistical analysis of the percentages of M1, M2, and Ly6Chigh macrophages among liver-infiltrating macrophages. Actual p values (left → right): 3.91e−8, 8.05e−7, 1.42e−8, 2.23e−8. d Absolute numbers of M1, M2, and Ly6Chigh macrophages in the liver. Actual p values (left → right): 0.000003, 0.000046, 0.000015, 0.000062. e Statistical analysis of the percentages of M1 (MHC II+CD206−) and M2 (MHC II−CD206+) macrophages among liver-infiltrating CD45+ cells. Actual p values (left → right): 8.05e−9, 0.000024. f, g Representative flow cytometry plots (f) and statistical analysis (g) of the percentages of TNF-α+, IL-6+, and IL-10+ cells among macrophages and Kupffer cells. Actual p values (left → right): g 0.000003, 0.000004, 8.02e−9, 0.000024, 0.0015, 0.034. h Relative mRNA levels of the indicated genes in livers. Actual p values (left → right): 0.00029, 0.00068, 0.0041, 0.014, 0.030, 0.025, 0.000036, 0.023, 0.0015, 0.016, 0.0060, 0.016, 0.00024, 0.00020, 0.000008, 0.00020. i, j Percentages of macrophages, neutrophils, DCs, and M1 and M2 macrophages among CD45.2+ cells in adipose tissue. Actual p values (left → right): i 1.27e−8, 0.0026, 0.000059; j 5.80e−9, 2.05e−8, 0.000019. k Relative mRNA levels of the indicated genes in adipose tissue. Actual p values (left → right): 7.29e−9, 1.82e−8, 0.00013, 0.022, 0.0052, 7.18e−8, 0.000016, 0.0017. Data are presented as the mean ± SD; n = 6 mice/group. Statistical analysis was performed by one-way ANOVA with post hoc multiple comparisons test. Two-sided p values < 0.05 were considered significant. *p < 0.05; **p < 0.01. Source data, including exact p values, are provided as a Source data file.

