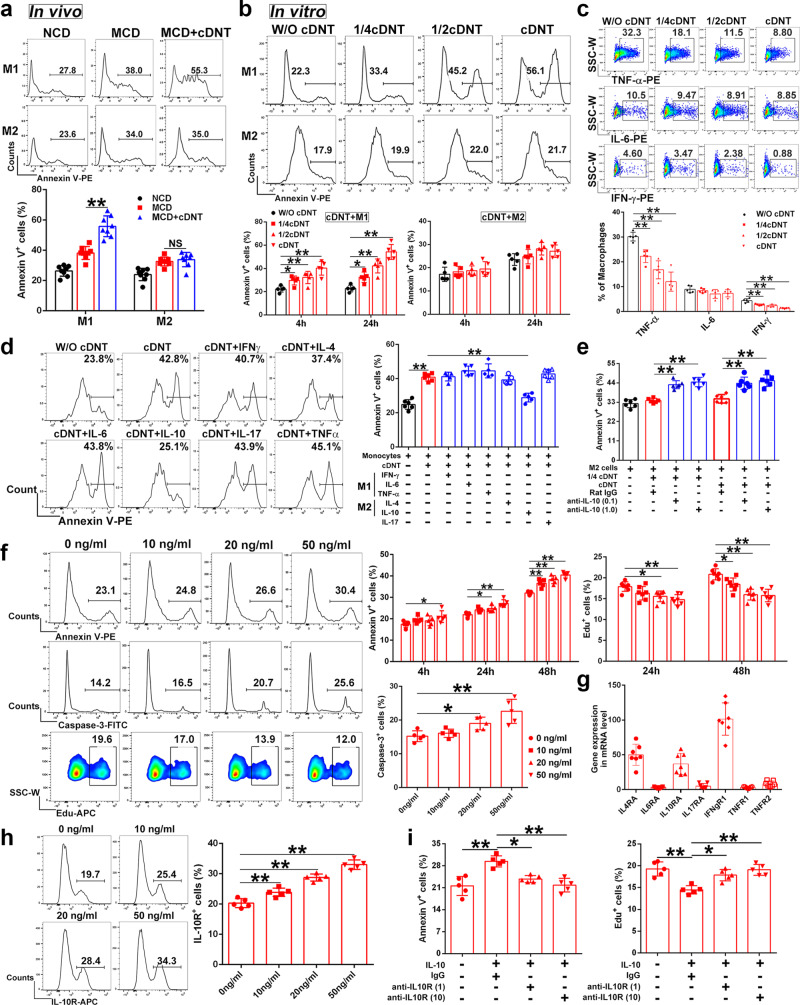
Fig. 4. M2 macrophages secreted IL-10 to decrease the suppressive functions of cDNT against M2 cells.
a Representative flow cytometry images showing the percentages of Annexin V+ cells among M1 and M2 macrophages in liver (top). Statistical analysis of Annexin V+ cells relative to hepatic M1 and M2 macrophages (bottom, n = 8 mice/group). NCD, black; MCD, red; MCD + cDNT, blue. Actual p values (left → right): 0.000002, 0.79. b CD45.1-positive M1 or M2 macrophages were cocultured with cDNT at different ratio for 4 or 24 h in vitro. Macrophage apoptosis were detected by flow cytometry (n = 5 biologically independent samples per group). W/O cDNT, black; W/cDNT, red. Actual p values (left → right): 0.036, 0.0095, 0.000029, 0.041, 0.00011, 2.57e−7. c CD45.1-positive bone marrow-derived macrophages were cocultured with cDNT at different ratio for 24 h in vitro. Macrophages TNF-α, IL-6, and IFN-γ secretion were detected by flow cytometry (n = 5 biologically independent samples per group). W/O cDNT, black; W/ cDNT, red. Actual p values (left → right): 0.0045, 0.00002, 3.92e–7, 0.00048, 0.000053, 1.85e−7. d Macrophages were pretreated with different cytokines (20 ng/ml) for 4 h, and cocultured with cDNT for 24 h. Statistical analysis of Annexin V+ cells relative to macrophages in each group (n = 6 biologically independent samples per group). W/O cDNT, black; W/ cDNT, red; W/cytokines pretreated cDNT, blue. Actual p values (left → right): 3.54e−10, 9.30e−7. e M2 macrophages were pretreated with anti-IL-10 neutralizing mAb (0.1 and 1.0 μg/ml) or IgG control for 4 h, and cocultured with cDNT for 24 h. Statistical analysis of Annexin V+ cells relative to M2 macrophages in each group (n = 6 biologically independent samples per group). W/O cDNT, black; W/ cDNT, red; W/anti-IL-10 mAb treated cDNT, blue. Actual p values (left → right): 0.000016, 7.57e−7, 0.000019, 0.000001. f cDNT incubated with anti-CD3/CD28 antibodies were stimulated with IL-10. cDNT apoptosis and proliferation were detected (n ≥ 5 biologically independent samples per group). Actual p values (left → right): for Annexin V+ cells, 0.044, 0.021, 0.000081, 0.0012, 0.000041, 8.80e−7; for Edu+ cells, 0.017, 0.00097, 0.021, 8.00e−6, 0.000004; for Caspase-3+ cells, 0.044, 0.00038. g The expression of cytokine receptors in cDNT were detected through real-time PCR (n = 7 biologically independent samples per group). h Representative flow cytometry (left) and statistical analysis (right) of IL-10R+ cells relative to cDNT after stimulation with IL-10 and anti-CD3/CD28 antibodies for 24 h (n = 5 biologically independent samples per group). Actual p values (left → right): 0.00057, 0.000002, 3.23e−9. i cDNT incubated with anti-CD3/CD28 antibodies were pretreated with anti-IL-10R neutralizing mAb (1 and 10 μg/ml) or IgG control for 4 h, and cocultured with IL-10 for 24 h. Statistical analysis of Annexin V+ and Edu+ cells relative to cDNT in each group (n = 5 biologically independent samples per group). Actual p values (left → right): for Annexin V+ cells, 0.0013, 0.035, 0.0018; for Edu+ cells, 0.0012, 0.037, 0.0019. Data are presented as the mean ± SD. Statistical analysis was performed by one-way ANOVA with post hoc multiple comparisons test. Two-sided p values < 0.05 were considered significant. *p < 0.05; **p < 0.01; NS not significant. Source data, including exact p values, are provided as a Source data file.

