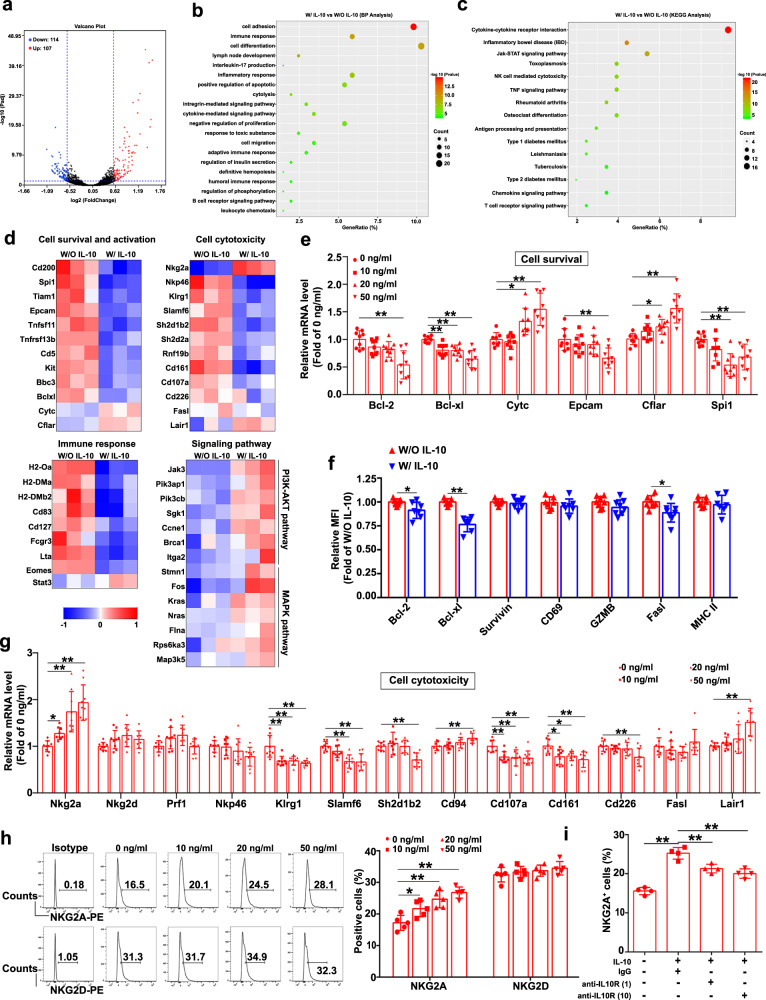
Fig. 5. Transcriptome sequencing analysis of IL-10-mediated regulation of cDNT.
a The distributions of upregulated (107) and downregulated genes (114; ≥1.5-fold difference, padj < 0.05) in cDNT treated with or without IL-10 are depicted in a volcano plot. b, c Biological process (BP) and KEGG pathway analyses were performed based on the significantly upregulated and downregulated genes in cDNT. d Heatmap showing the upregulated and downregulated genes related to cell survival and activation, cell cytotoxicity, immune responses, and signaling pathways in cDNT. e The significantly changed genes related to cell survival were confirmed via real-time PCR after IL-10 stimulation of cDNT (n = 9 biologically independent samples per group). Actual p values (left → right): 0.00026, 0.0037, 0.0028, 6.50e−7, 0.012, 0.000024, 0.0017, 0.048, 5.68e−7, 0.000081, 0.0072. f Relative expression of cell markers plotted as the fold change in expression compared to cDNT without IL-10 stimulation (n = 6 biologically independent samples per group). W/O IL-10, red; W/IL-10, blue. Actual p values (left → right): 0.027, 0.000008, 0.030. g The expression of cell cytotoxicity-related genes were determined via real-time PCR (n = 9 biologically independent samples per group). Actual p values (left → right): 0.047, 0.000076, 0.000002, 0.00019, 0000025, 00000024, 0.00015, 0.000097, 0.0031, 0.000069, 0.0078, 0.0046, 0.0038, 0.012, 0.020, 0.0011, 0.0054, 0.00022. h Representative flow cytometry plots (left) and statistical analysis (right) of NKG2A+ and NKG2D+ cells among cDNT after IL-10 stimulation (n = 5 biologically independent samples per group). Actual p values (left → right): 0.038, 0.00067, 0.000045. i cDNT incubated with anti-CD3/CD28 antibodies were pretreated with anti-IL-10R neutralizing mAb (1 and 10 μg/ml) or isotype control for 4 h, and cocultured with IL-10 (50 ng/ml) for 24 h. Statistical analysis of NKG2A+ cells relative to cDNT in each group (n = 4 biologically independent samples per group). Actual p values (left → right): 5.06e−7, 0.0030, 0.00028. Data are presented as the mean ± SD. Statistical analysis for f was performed by Student’s t test, and others were performed by one-way ANOVA with post hoc multiple comparisons test. Two-sided p values < 0.05 were considered significant. *p < 0.05; **p < 0.01. Source data, including exact p values, are provided as a Source data file.

