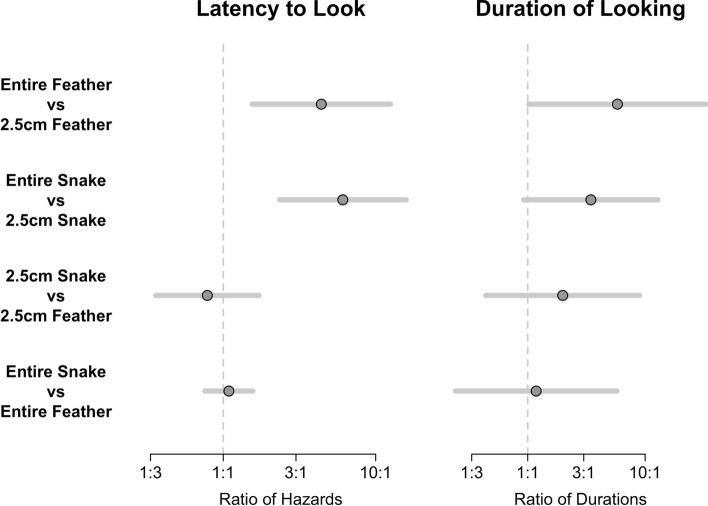
Figure 5.
Results from eight planned contrasts assessing latency to look and duration of looking in response to feather and snake stimuli. Center dots represent the average marginal contrast. For latency to look, a center dot to the right of the 1:1 line indicates that the hazard for the first stimulus in the comparison is greater, and therefore that the latency to look is shorter. For duration of looking, a center dot to the right of the 1:1 line indicates that duration for the first stimulus in the comparison is greater. The error bars represent ± 2.73 SE of the marginal contrast, as appropriate for eight planned comparisons. The horizontal axes reflect ratio comparisons of the paired stimuli––hazard ratio for latency to look and ratio of durations for duration of looking. For example, the hazard for the entire feather was more than three times the hazard for the 2.5 cm feather, on average.

