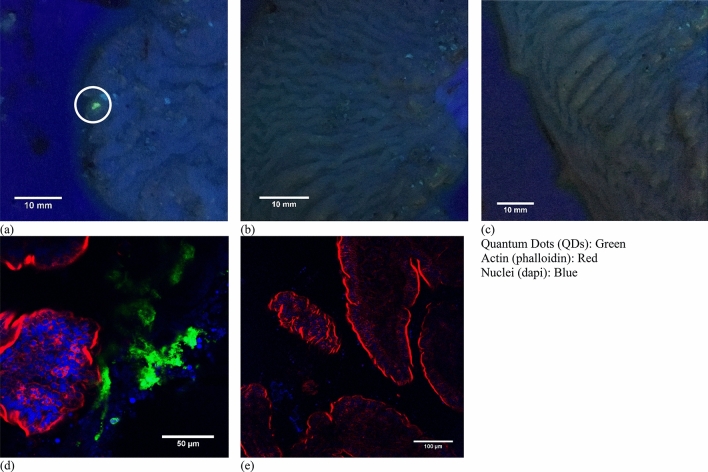
Figure 4.
(a–c) Tissue from animal 20170921-P1. (a) Tissue sections exposed to insonation and QDs (white circle). (b) Tissue from area exposed to insonation only (no QDs). (c) Tissue from area exposed to QDs only. (d,e) Immunofluorescent staining of samples (a,c). The QDs were never detected inside epithelial cells marked by F-actin (red), which is highly concentrated in the apical brush border.
Images a, b and c are reproduced with permission from28.

