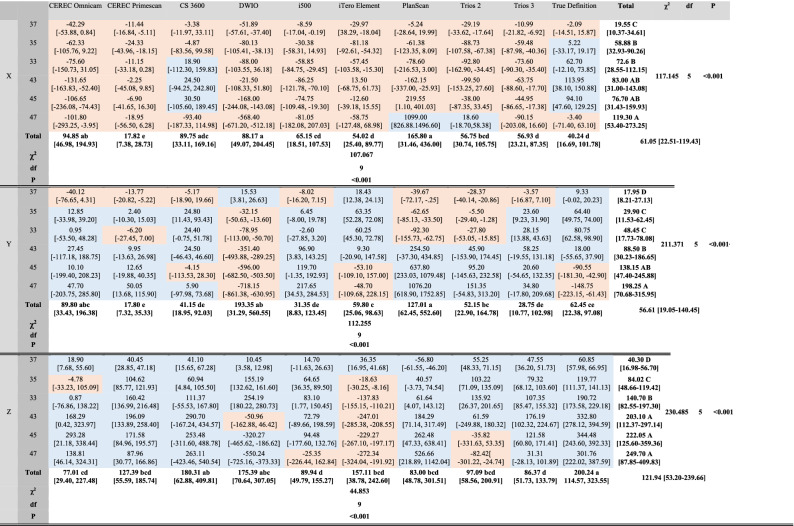
Table 2.
Trueness values (μm) of IOSs at each cylinder position in XYZ axes.
χ2, chi-square; df, degrees of freedom; p, p-value.
Interquartile ranges [1st quartile, 3rd quartile] are in parentheses.
Different uppercase letters within the same column indicate statistically significant differences among cylinder positions; different lowercase letters within the same row indicate statistically significant difference among IOSs (multiple comparison by Mann–Whitney U test with Bonferroni correction) (p < 0.05).
Positive (in blue shade) and negative values (in red shade) indicate deviation to the right and left in X-axis, forwards and backwards in Y-axis, upwards and downwards in Z-axis, respectively.
Absolute values were used for statistical analysis.

