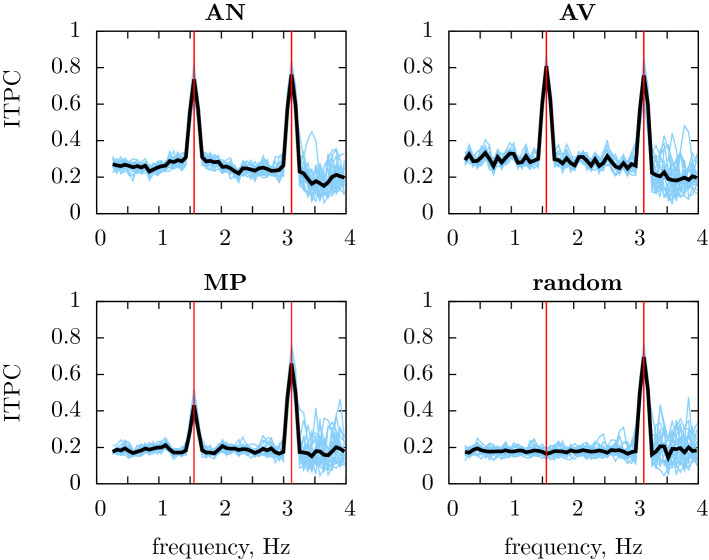
Figure 2.
ITPC of the simulated EEG calculated from the word2vec representation for the four conditions. The model yielded peaks in ITPC at the rate of syllable presentation (3.125 Hz) in each of the four conditions (AN, AV, MP, random). Vertical red lines represent the frequency at which syllables and two-word sequences are presented, the blue lines show responses for 20 simulated particants, the black is the grand average over these participants.

