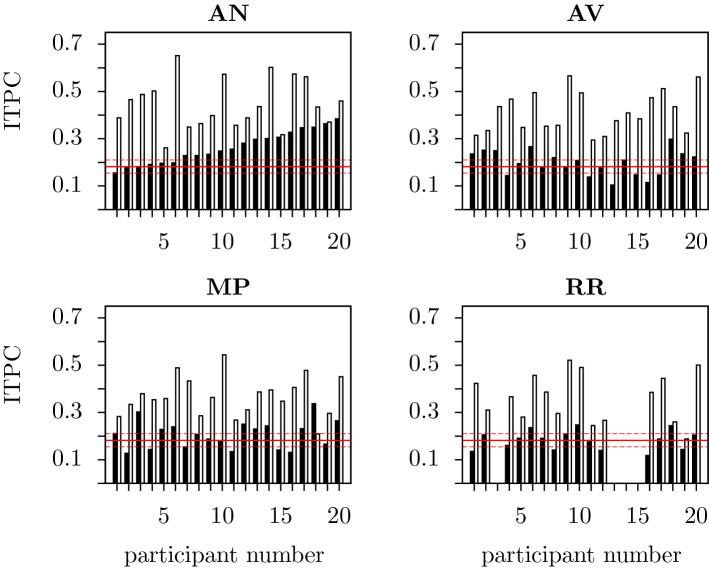
Figure 4.
ITPC responses from individual participants at the phrase rate (3.125 Hz; filled bars) and the syllable rate (1.5625 Hz; unfilled bars) in each of the four conditions (AN, AV, MP, RR). For the AN, AV and MP conditions, values of the ITPC at each frequency of interest are displayed for each of the 20 participants, for RR, for the 16 participants. Participants one to 20 are ordered in accordance to their ITPC at the phrase frequency in the AN condition, in increasing order from left to right. Red horizontal lines indicate the mean ITPC value for random phases along with the corresponding significance thresholds (). These values are the same for both frequencies and so any ITPC that is above the upper red line is significantly higher than chance level.

