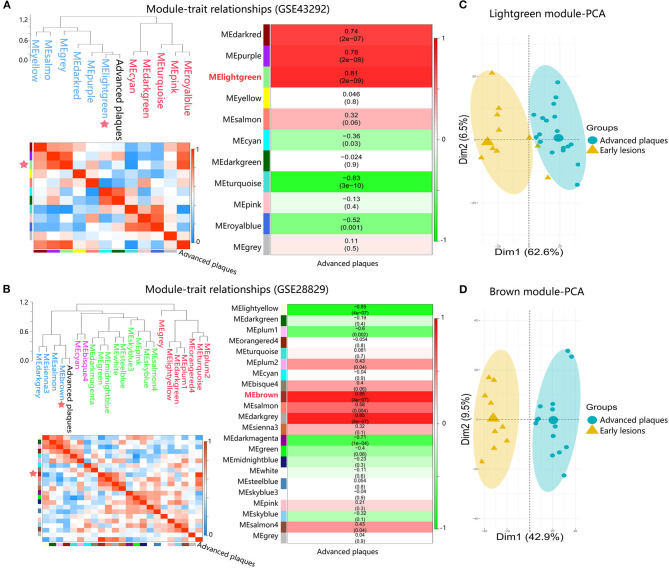
Figure 3.
Identification of advanced plaque-related modules in dataset GSE43292 and GSE28829. (A,B) Module-trait associations. Branches of the dendrogram group together module eigengene values that are positively correlated. Each row and column in the lower left heatmap correspond to one module eigengene (labeled by color) or advanced plaques, in which blue color represents negative correlation, while red represents positive correlation. Each row in the right heatmap corresponds to a module eigengene, column to the advanced plaques. Each cell contains the corresponding correlation and p-value. The table is color-coded by correlation according to the color legend. (C,D) The PCA for genes within advanced plaque-related modules in response to advanced plaques.

