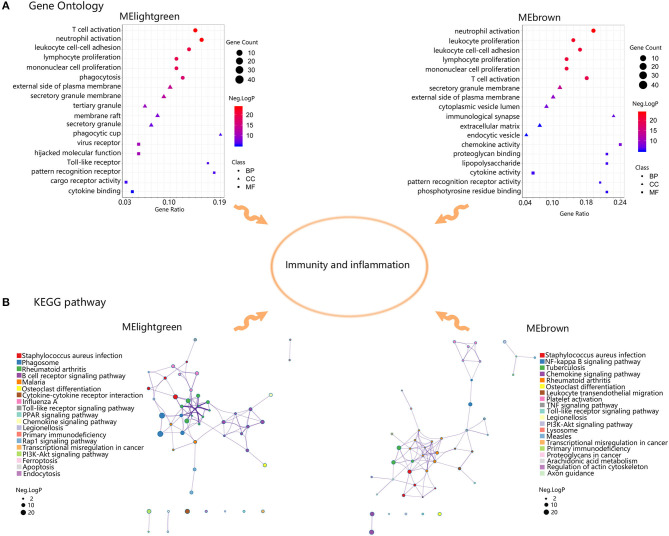
Figure 5.
Functional enrichment analysis of genes in MElightgreen and MEbrown. (A) Gene Ontology enrichment results of MElightgreen and MEbrown. The sizes of the dots represent the counts of enriched module genes, and the dot color represents the negative Log10 (p-value). (B) Kyoto Encyclopedia of Genes and Genomes (KEGG) enrichment results of MElightgreen and MEbrown. The sizes of the dots represent the negative Log10 (p-value).

