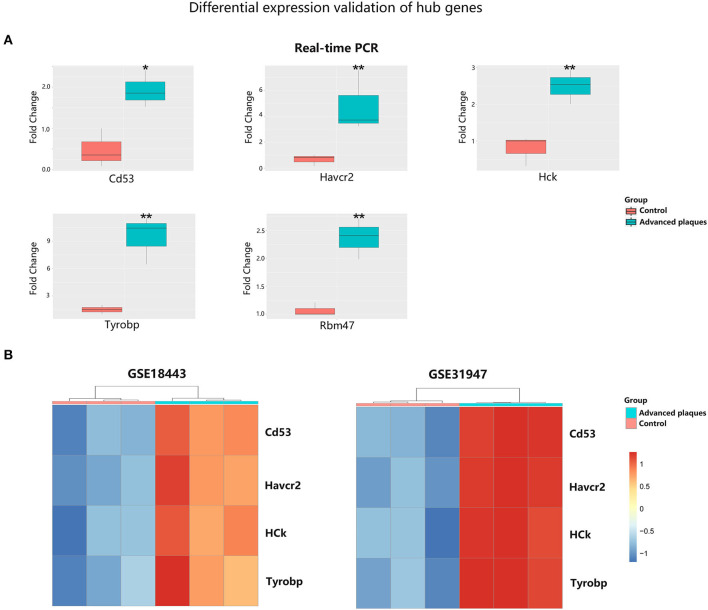
Figure 7.
Validation of hub gene expression in experimental atherosclerosis models. (A) Quantitative real-time PCR of ApoE−/− mice aortic tissues. The data are shown as the relative fold change in expression. (B) Heatmap of differentially expressed hub genes in dataset GSE18443 and GSE31947. *p < 0.05, **p < 0.01.

