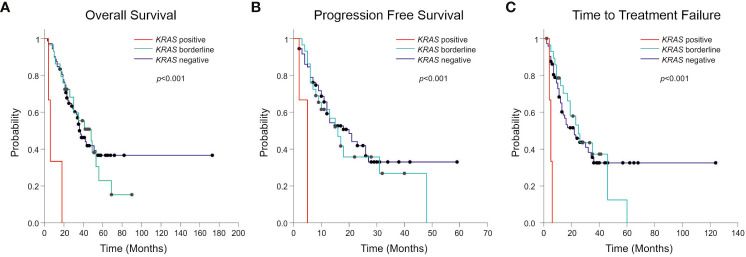
Figure 2.
Kaplan-Meier curves showing Overall Survival (OS) (A), Progression Free Survival (PFS) (B) and Time to Treatment Failure (TTF) (C) according to the presence, the absence, or borderline positivity (1–2 positive droplets) of KRAS mutation. The p-value related to the presence or the absence of KRAS mutation is reported in figure.

