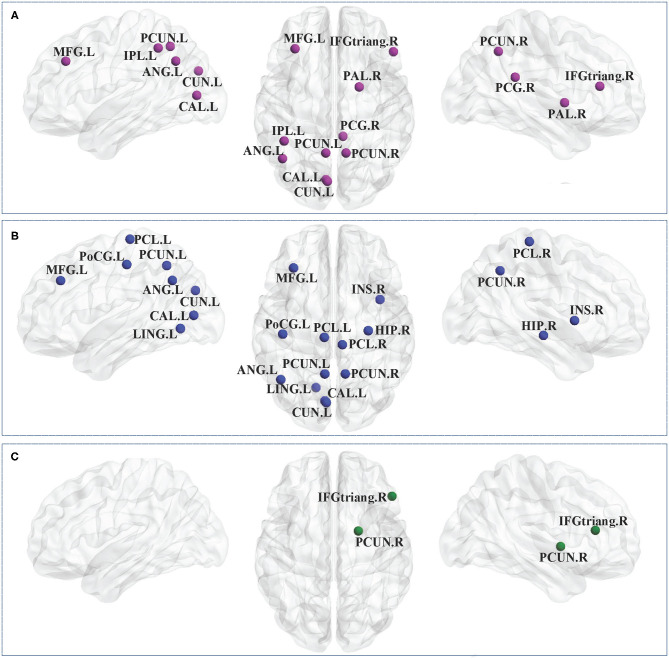
Figure 2.
Brain regions with significant group effects in the nodal clustering coefficient between the CP1, CP2, and HC groups (post hoc t-test; FDR-corrected P < 0.05). CP1, children with bilateral spastic cerebral palsy before treatment; CP2, children with bilateral spastic cerebral palsy following treatment; HC, health children. (A) Statistical comparisons between CP1 and HC; (B) statistical comparisons between CP2 and HC; (C) statistical comparisons between CP1 and CP2. FDR, false discovery rate. FDR-corrected P < 0.05 indicated statistically significant differences between groups.

