Figure 2.
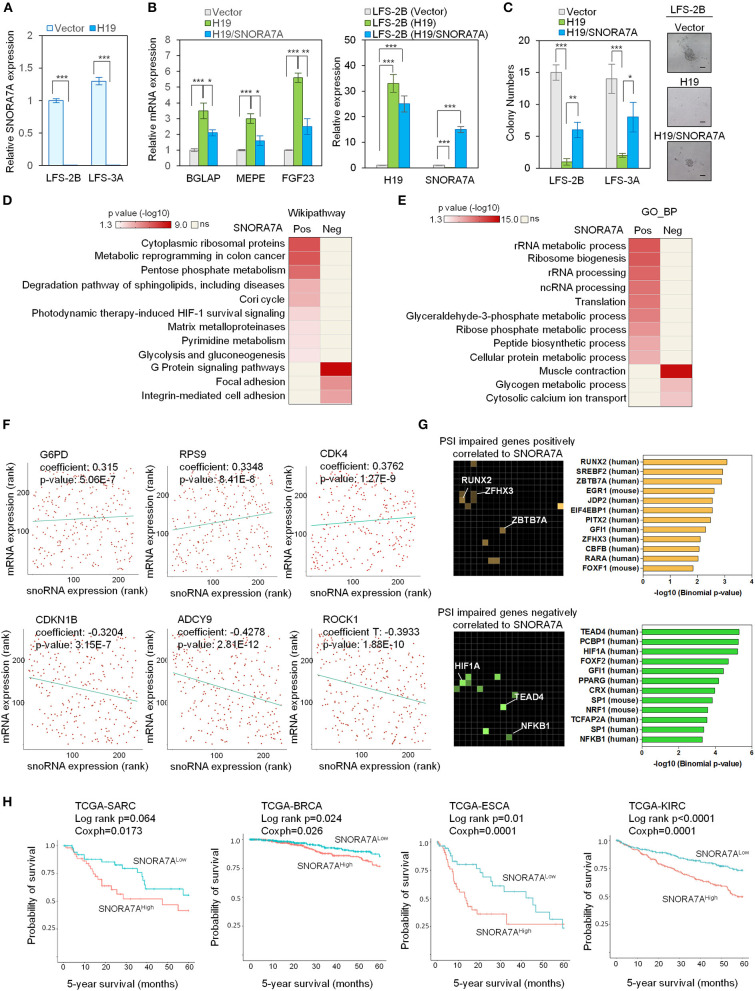
Systems analyses of the oncogenic role of SNORA7A from TCGA datasets. (A) Ectopic expression of H19 downregulates SNORA7A expression in LFS osteoblasts. qRT-PCR data are represented as mean ±SEM; n = 3 biological replicates; statistical significance is determined using two-tailed Student's t-test; ***p < 0.001. (B) Left panel, ectopic expression of H19 increases osteogenic gene expression in LFS osteoblasts; in contrast, restoration of SNORA7A expression impairs H19-upregulated osteogenic gene expression in H19-transduced LFS osteoblasts. Right panel, qRT-PCR results demonstrate the expression of H19 and SNORA7A upon their ectopic expression for assays in the left panel. qRT-PCR data are represented as mean ± SEM; n = 3 biological replicates; statistical significance is determined using two-tailed Student's t-test; *p < 0.05; **p < 0.01; ***p < 0.001. (C) AIG assay for in vitro tumorigenicity demonstrates that H19 impairs the colony numbers of LFS osteoblasts and SNORA7A expression rescues the H19-suppressed tumorigenicity of LFS osteoblasts. H19 or H19/SNORA7A-transduced LFS osteoblasts were grown for 1 month and then assayed. Positive colonies are considered those larger than 50μm diameter. Data are represented as mean ± SEM; n = 6 biological replicates; statistical significance is determined using two-tailed Student's t-test; *p < 0.05; **p < 0.01; ***p < 0.001. (D,E) Genes positively (n = 780) and negatively (n = 945) correlated with SNORA7A expression in TCGA-SARC are identified. Pathway analysis by Wikipathway (A) and GO_BP (B) is performed on these gene sets using Enrichr to identify pathways significantly enriched or depleted (p ≤ 0.05) in association with SNORA7A expression. (F) Scatterplots of G6PD, RPS9, CDK4, CDKN1B, ADCY9, and ROCK1 mRNA expression correlation with SNORA7A expression. (G) Genes whose abnormal splicing (including exon skip, mutually exclusive splicing, or intron retention) by PSI was positively (n = 91, upper panel) or negatively (n = 182, lower panel) correlated with SNORA7A expression in sarcomas are identified by TRANSFAC and JASPAR PWWMs in Enrichr. PSI: percent spliced in index. (H) High SNORA7A expression is associated with poor cancer survival. Five-year overall survival is analyzed according to SNORA7A expression from TCGA in various cancers. SARC: sarcoma. BRCA: breast invasive carcinoma. ESCA: esophageal carcinoma. KIRC: kidney renal clear cell carcinoma.

