
Figure 1.
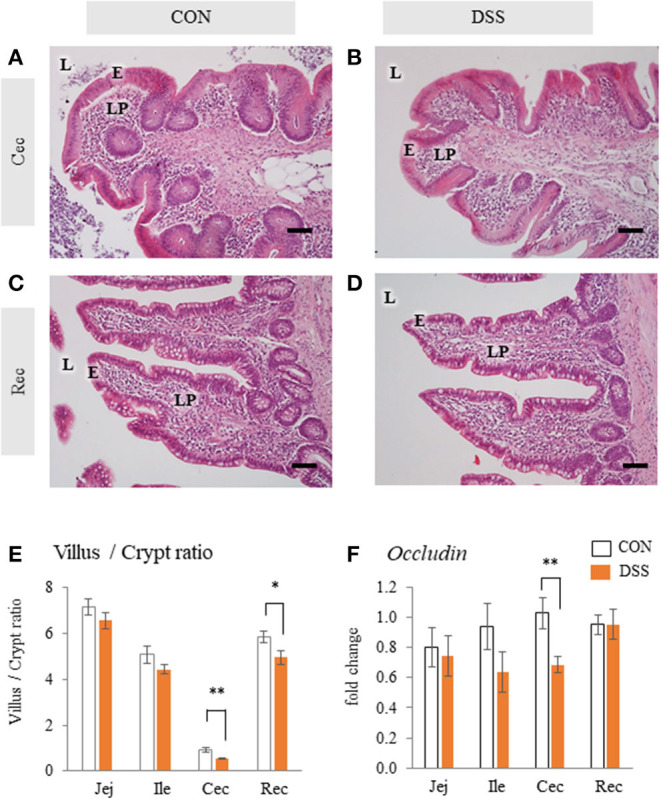
Histology and Occludin mRNA expression in the intestinal mucosa with or without dextran sodium sulfate (DSS). Micrographs demonstrate the HE staining of the cecum [Cec: (A) and (B)] and rectum [Rec: (C) and (D)] in hens orally administered DSS (DSS group) or water (CON group). E = mucosal epithelium, L = lumen, LP = lamina propria. Scale bars = 50 μm. (E) Ratio of villus height/ crypt depth of jejunum (Jej), ileum (Ile), Cec, and Rec. Open bars represent the control group, and orange filled bars represent the DSS group. Values are the ratio of villus height/crypt depth (CON and DSS, n = 8 and 7). (F) Effects of the oral administration of DSS on the mRNA expression of Occludin in the intestinal mucosa. Values are the fold change in target gene expression when compared to a standard sample from the CON group of each segment (CON and DSS, n = 8 and 7). Target gene expression was normalized to the house-keeping gene RPS17. Asterisks (*, **) indicate significant differences between the CON and DSS groups (P < 0.05 and P < 0.01, respectively).