
Figure 1: Flow diagram.
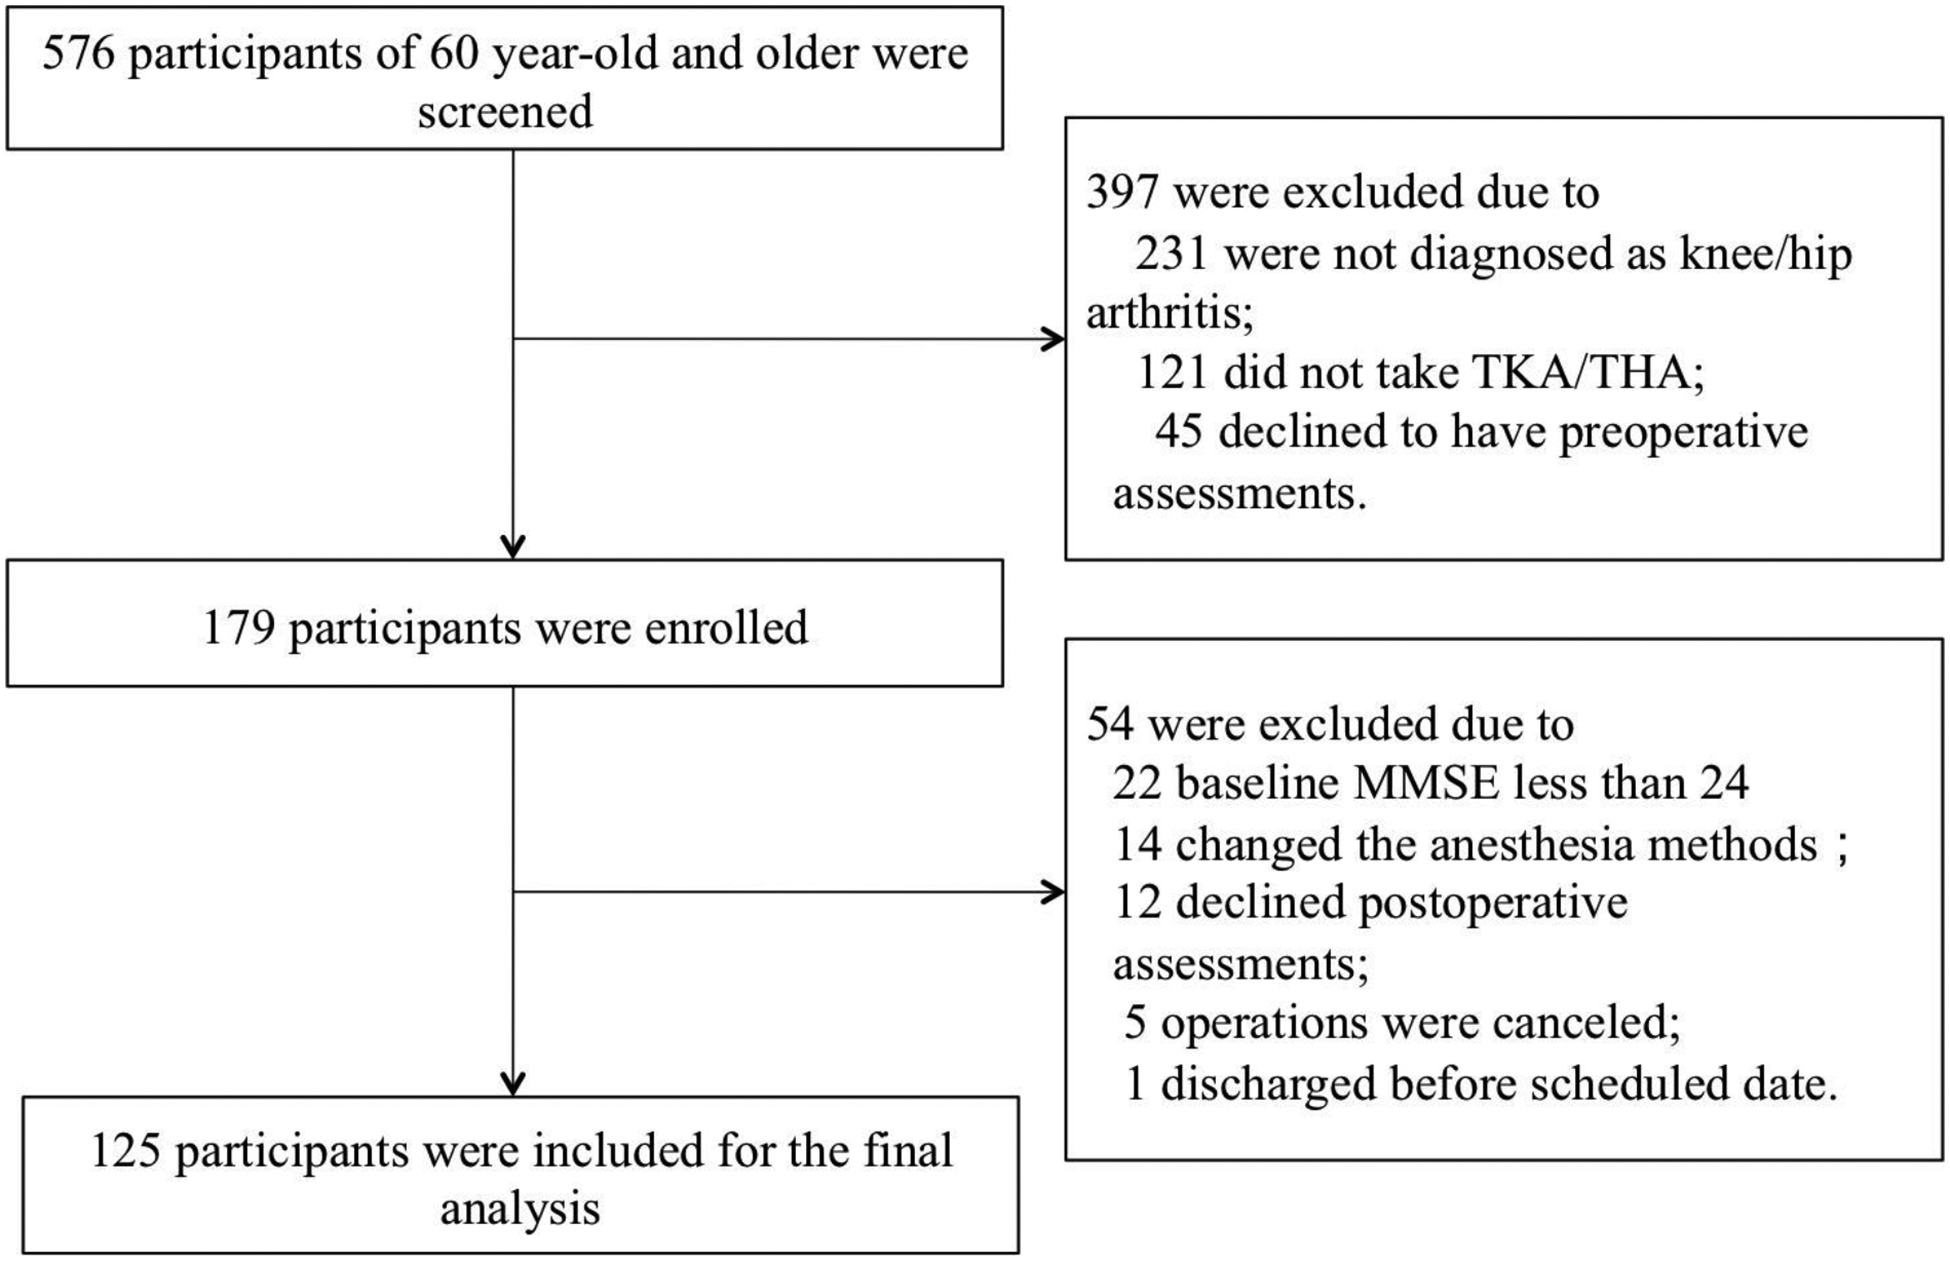
The flow diagram shows that 576 participants of 60 year-old and older were screened for the study and 179 participants were enrolled in the study. There were 54 participants who were further excluded, resulting in 125 participants for the final data analysis.