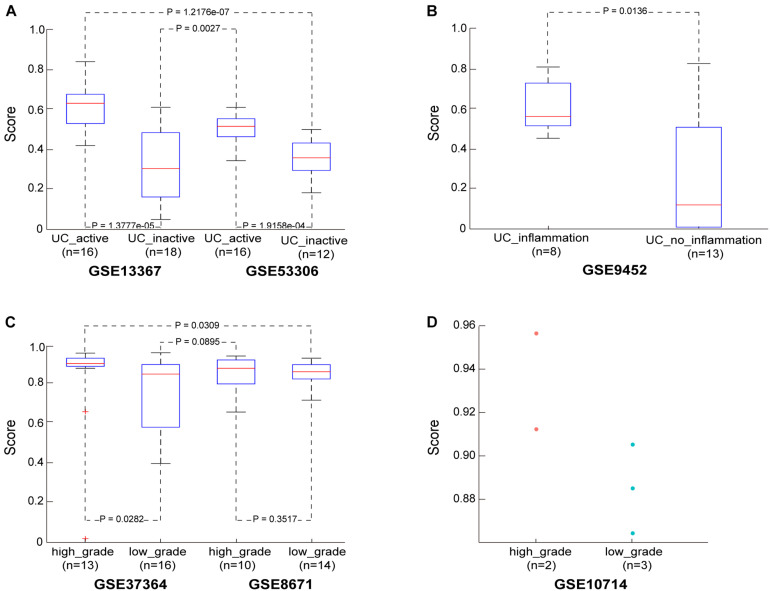
FIGURE 2.
The performance of the CRC risk signature in UC and adenoma samples. (A) The score in the UC samples from dataset GSE13367 and GSE53306. (B) The score in the UC samples from dataset GSE9452. (C) The score in the adenoma samples from dataset GSE37364 and GSE8671. (D) The score in the adenoma samples from dataset GSE10714.

