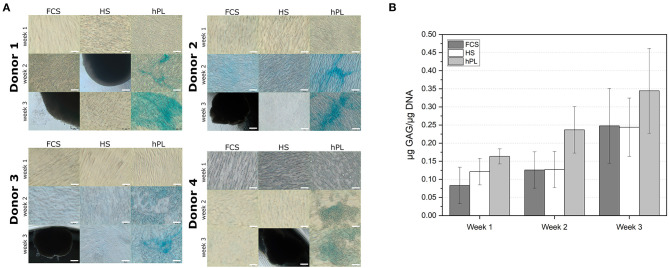
Figure 6.
(A) Alcian Blue staining of the hAD-MSCs from four donors differentiated in the presence in 2.5% hPL, 10% HS, or 10% FCS. 10× objective, scale bar 100 μm. (B) Determination of the GAG deposition in cells (in μg GAG/μg DNA) differentiated for 7, 14, and 21 days under influence of FCS, HS, and hPL. Data represent the mean ± SD of two independent experiments in threefold determination for two donors.

