Figure S2.
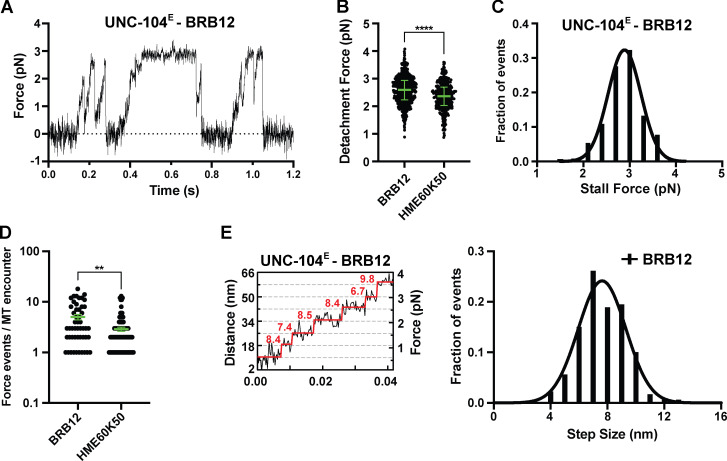
Analysis of UNC-104 force generation in BRB12 buffer. (A) Representative force versus time record of bead movement driven by a single molecule of UNC-104(1–389)E. (B) UNC-104(1–389)E detachment forces measured in BRB12 and HME60K50 (reproduced from Fig. 1 G for comparison). Green bars in B and D indicate the median values with quartiles. UNC-104(1–389)E in BRB12: 2.59 (2.23, 2.94) pN, n = 561; UNC-104(1–389)E in HME60K50: 2.37 (2.03, 2.70) pN, n = 355. Statistical significance was determined by using an unpaired Welch’s t test (****, P < 0.0001). (C) Stall force histogram of UNC-104(1–389)E in BRB12 (2.89 ± 0.02 pN, mean ± SEM from Gaussian fit; stall plateaus ≥10 ms; n = 126) compiling forces at k = 0.05–0.06 pN/nm. (D) Number of engagement events per MT encounter. UNC-104(1–389)E in BRB12: 5.0 ± 0.6 (mean ± SEM, n = 50); UNC-104(1–389)E in HME60K50: 2.9 ± 0.3 (mean ± SEM, n = 92). **, P < 0.0022. (E) Left, stepwise forward movements of UNC-104(1–389)E in BRB12 (trap stiffness: k = 0.06 pN/nm). The raw data are shown in black, and the steps detected by the step-finding program are shown in red. Right, measured step sizes: 7.6 ± 0.1 nm (mean ± SEM from Gaussian fit; n = 180).

