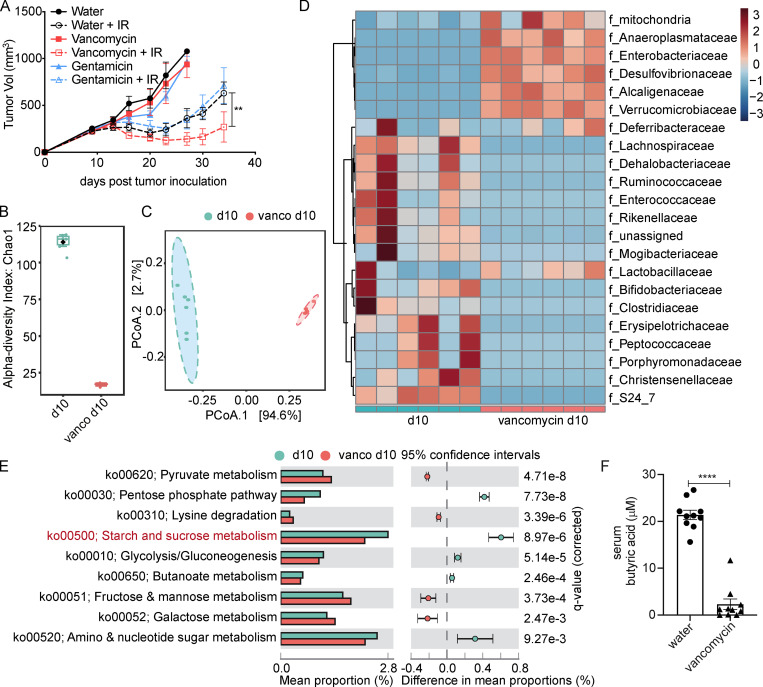
Figure 1.
Oral administration of vancomycin promotes IR response and eliminates most butyrate-producing bacteria. (A) SPF C57BL/6 mice (n = 5/group) were given oral vancomycin or gentamicin for 1 mo and then injected s.c. with 106 MC38 cells, and established tumors were irradiated (20 Gy) on day 10 after tumor inoculation. The volume of tumors was measured twice a week. Two-way ANOVA tests were used to analyze the tumor growth data. **, P < 0.01. One of three representative experiments is shown. (B) Comparison of within-sample diversity (α-diversity) fecal samples from vancomycin-treated or untreated mice, based on Chao1 index. n = 6/group; P = 0.0042667. (C) Unconstrained principal coordinate analysis (PCoA) of fecal samples from vancomycin-treated or untreated mice, based on unweighted UniFrac dissimilarity matrix between the two groups (n = 6/group). ANOSIM revealed significant differences (P < 0.002). (D) Bacterial taxa observed from vancomycin-treated or untreated mice, shown at the family level. (E) Prediction of changed butyrate production–associated KEGG pathways using Tax4fun analysis based on the SILVA database. Extended error bar plots illustrate differential representation by mean proportion and their differences based on KEGG orthologue groups, ranked by respective effect size of 0.5 thresholds in the Statistical Analysis of Metagenomic Profiles software package (http://kiwi.cs.dal.ca/Software/STAMP). Bar plots on the left side display the mean proportion of each KEGG pathway. Dot plots on the right show the differences in mean proportions between the two indicated groups using q values. (F) Sera from vancomycin-treated and untreated C57BL/6 mice was collected after 1 mo of feeding (control group, n = 10; vancomycin-treated group, n = 10). Unpaired t tests were used to analyze F. ****, P < 0.0001. One representative experiment (out of two experiments in F or three experiments in A) is shown.

