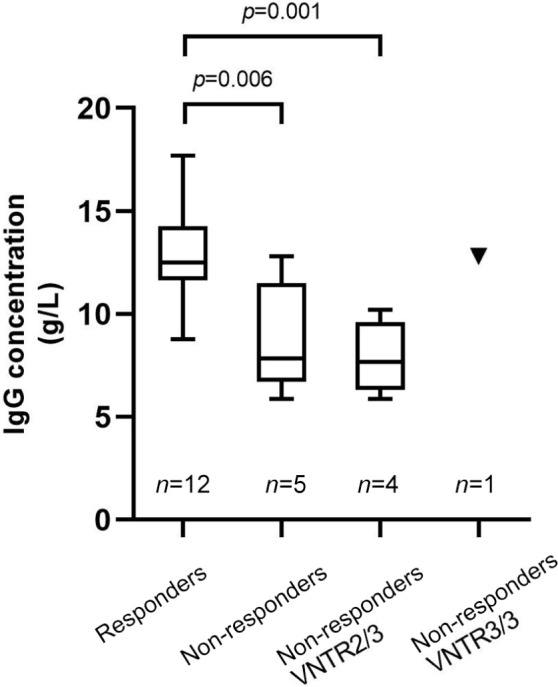
Figure 2.

Comparison of endogenous IgG levels before intravenous immunoglobulin therapy in myasthenia gravis patients. Grouping was based on therapeutic effects and VNTR genotypes. The comparison of IgG levels was performed between 12 responders (who were all VNTR3/3 genotypes) and five non-responders. Among the non-responders, four patients were VNTR2/3 genotypes (presented in the third column) and one patient was VNTR3/3 (presented as the triangle on the rightmost column). Data are shown in box-plots with the center line, lower and upper borders of the box representing medians, 25th and 75th percentiles of the sample. The whiskers indicate minimal and maximal extreme values of the sample.
VNTR, variable number tandem repeat.
