FIG 1.

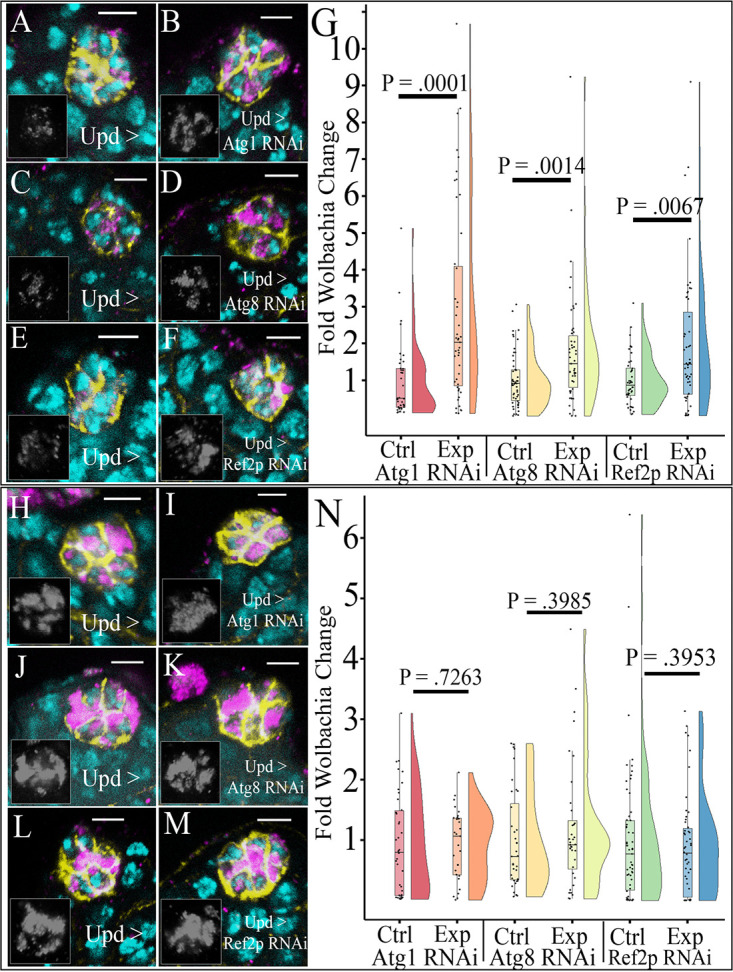
Knockdown of selective autophagy increased density of Wolbachia strain wMel but not wMelCS in the hub. Representative confocal z-stacks of hubs expressing RNAi against autophagy genes. Unpaired (Upd) was used to express small interfering RNAs (siRNAs) specifically in the hub and not male germ line and soma in the testis. DNA is colored cyan, D cadherin (labeling the hub) is yellow, and the HSP60 antibody detecting Wolbachia is in magenta. The insets display grayscale images of only the Wolbachia channel from the respective image. (A) Sibling control hub of wMel-infected male testis displaying Wolbachia at a low density. (B) Knockdown of Atg1 increased wMel density in the hub. (C) Control Atg8 RNAi wMel-infected male hub displaying low Wolbachia density. (D) Knockdown of Atg8 in the hub increased wMel density. (E) Control Ref(2)p RNAi hub of wMel-infected male testis where Wolbachia is at a low density. (F) Knockdown of Ref(2)p with RNAi increases Wolbachia wMel density in the hub. (G) Vertical raincloud plots display each quantified value overlaid on a box and whisker plot showing the median value, upper and lower quartiles (box), and upper and lower extremes (whiskers, 1.5× interquartile range). A split violin plot accompanies each box and whisker plot which displays the probability density function of the data set. Quantification of relative Wolbachia density reveals a significant increase in Wolbachia density upon knockdown of either Atg1 (Ncont = 37, Nexp = 47), Atg8 (Ncont = 54, Nexp = 50), or Ref(2)p (Ncont = 44, Nexp = 52) in the hub. (H) Control Atg1 RNAi hub of wMelCS (CS)-infected male testis where Wolbachia is at a moderate/high density. (I) Knockdown of Atg1 has no significant effect on moderating the density of CS. (J) Control Atg8a RNAi hubs of CS-infected male testis display a moderate/high density. (K) Atg8a knockdown displays a moderate/high density of CS similar to that for the control. (L) Control Ref(2)p hub of wMelCS-infected hubs displays moderate density. (M) Knockdown of Ref(2)p does not result in any change in wMelCS density, displaying moderately infected hub densities. (N) Quantification of relative CS density in the hub shows no difference in density upon knockdown of Atg1 (Ncont = 39, Nexp = 31), Atg8 (Ncont = 36, Nexp = 36), or Ref(2)p (Ncont = 59, Nexp = 50). Scale bars, 5 µM. Mann-Whitney U tests were performed for statistical analysis.
