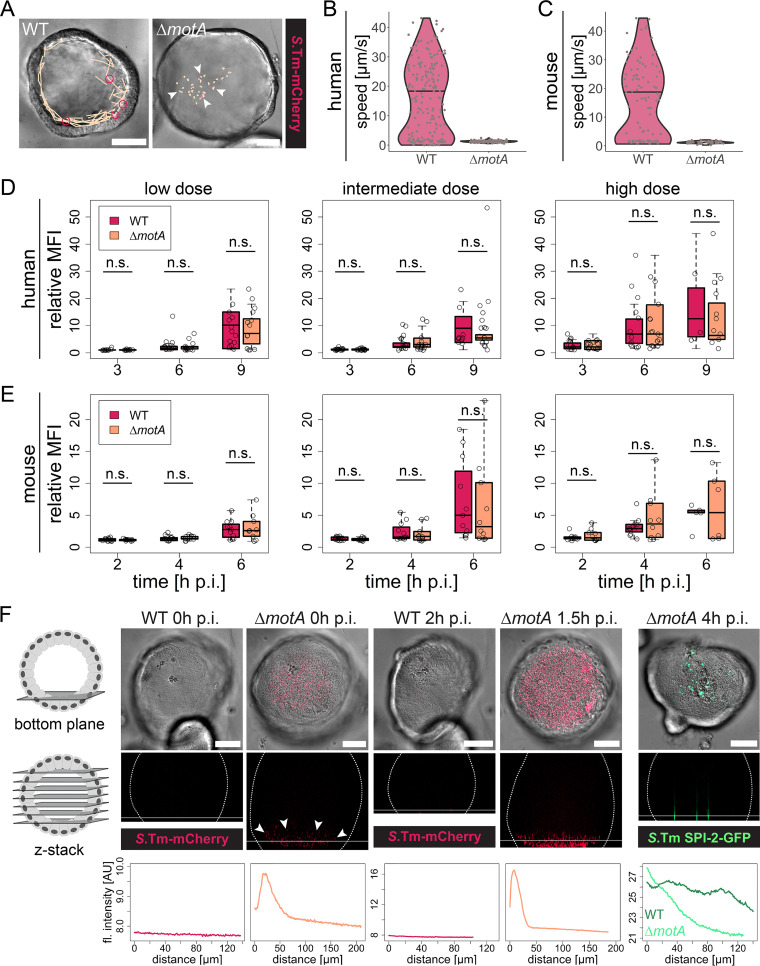
FIG 3.
Salmonella Typhimurium flagellar motility is dispensable for human and murine enteroid colonization. Human and murine enteroids were injected with Salmonella Typhimurium (S.Tm) WT or ΔmotA carrying the constitutive rpsM-mCherry reporter (A to F) or the SPI-2-inducible pssaG-GFP reporter (F). (A) Tracking of individual Salmonella Typhimurium WT (left) or Salmonella Typhimurium ΔmotA (right) within the human enteroid lumen, as in Fig. 1B. The images show one frame of the time-lapse movie used for tracking. Orange lines indicate the complete tracks over the entire movie. Arrowheads mark nonmotile bacteria, whereas pink circles indicate examples of motile bacteria engaged in near-surface swimming. Bars, 50 μm. (B and C) Quantification of Salmonella Typhimurium motility within the human (B) and murine (C) enteroid lumen based on bacterial tracking as shown in panel A. Each dot represents one bacterial track, and the horizontal line depicts the median. The data are based on >120 individual tracks per condition originating from two independent experiments, in which motility was quantified in a total of 13 enteroids injected with Salmonella Typhimurium WT and 7 enteroids injected with Salmonella Typhimurium ΔmotA (B; human enteroids), or >50 individual tracks per condition originating from two independent experiments, in which a total of 10 enteroids injected with Salmonella Typhimurium WT and 3 enteroids injected with Salmonella Typhimurium ΔmotA were analyzed. (D and E) Quantification of enteroid colonization 3, 6, and 9 h p.i. (D; human enteroids) or 2, 4, and 6 h p.i. (E; murine enteroids), as detailed in the legend to Fig. 2. The height of the boxes represents the IQR, whereas the horizontal line depicts the median. Whiskers extend to the most extreme data point but no further than 1.5× the IQR from the lower (first quartile) or upper (third quartile) boundary of the box. All data points are indicated as circles. The data for each species are based on five independent experiments, in which enteroids embedded within the same Matrigel dome were injected with either strain. Data points for which the relative fluorescence intensity was decreasing again following bacterial escape from the enteroid lumen were excluded from analysis. Statistical significance was determined by two-way ANOVA with Tukey’s HSD post hoc test. (F) Human enteroids embedded within the same dome were injected with Salmonella Typhimurium WT or Salmonella Typhimurium ΔmotA carrying the constitutive rpsM-mCherry or the SPI-2-inducible pssaG-GFP reporter, and confocal (rpsM-mCherry) or wide-field (pssaG-GFP) z-stacks were acquired at the indicated time points p.i. Background subtraction was performed in Fiji for better visualization of the bacterial fluorescence. For the bottom plane, both the DIC and fluorescence channels are shown, whereas only the fluorescence channel is shown for the xz projection (z-stack). The dotted lines in the xz projections show the enteroid outline, and the horizontal line indicates the position of the bottom-plane image. The fluorescence intensity profiles along the z axis starting at the bottom of the enteroid (0 μm) are depicted below the respective images. In the rightmost graph, the fluorescence profile for an enteroid injected with the Salmonella Typhimurium WT is included for comparison. Bars, 50 μm. n.s., nonsignificant; MFI, mean fluorescence intensity; AU, arbitrary units.

