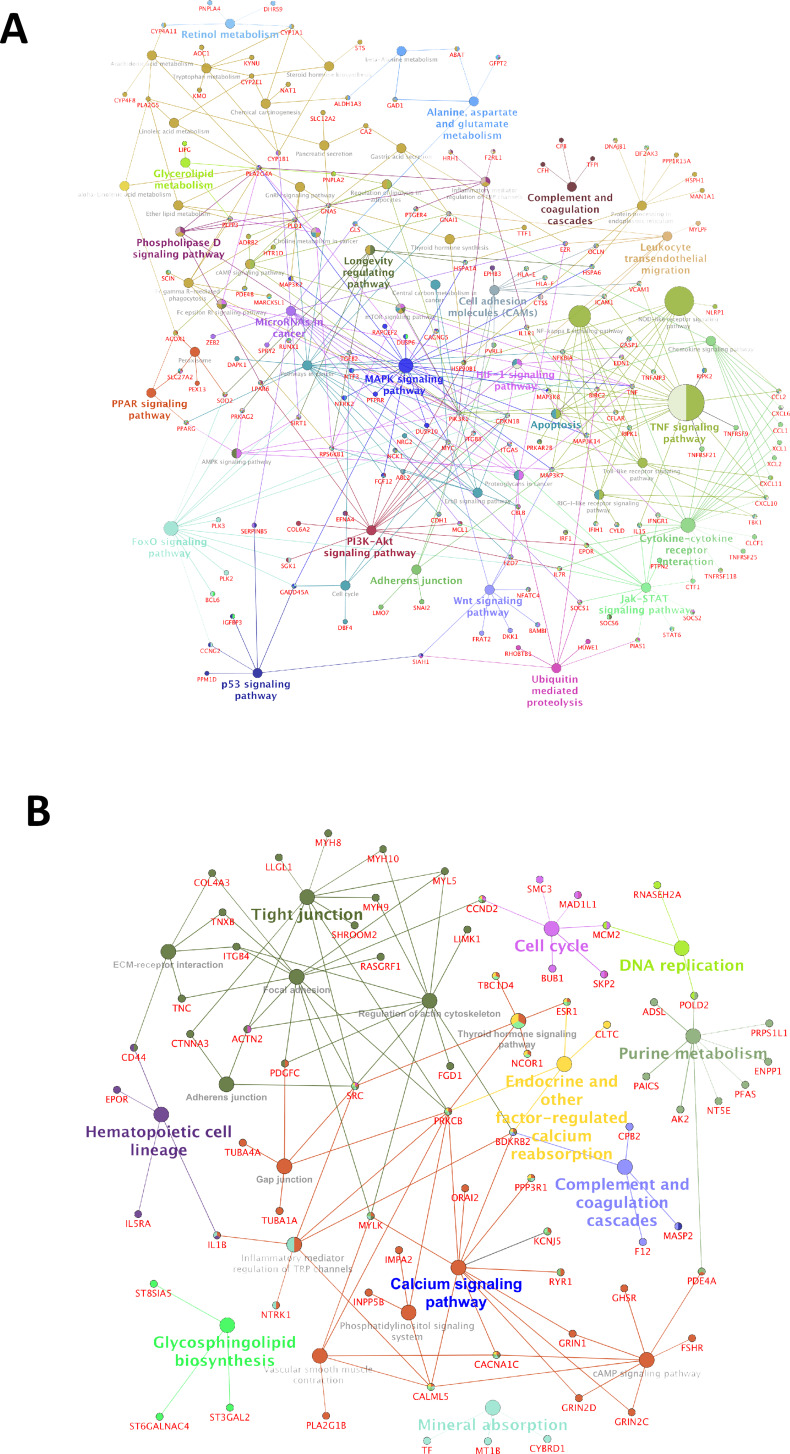
Figure 1.
Network mapping of differentially expressed genes in side population 1 (SP1). (A) Schematic representation of pathways and genes upregulated in the tumorigenic SP fraction in comparison to the nontumorigenic main population (MP) fraction. (B) Functional classification of downregulated genes and their interactants specifically expressed in SP1 fraction in comparison to MP1. All major pathways have been represented in colored circles (also see supplementary Excel sheet S1 available at http://rgcb.res.in/OncologyResearch.php).

