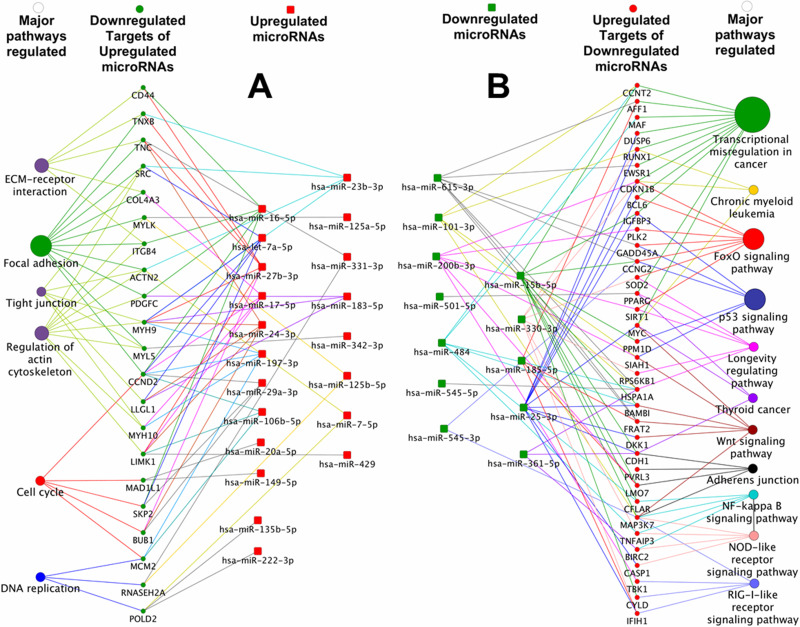
Figure 2.
MicroRNA–mRNA target interaction and pathways perturbed. (A) Functional grouping and network mapping of interactants of upregulated microRNAs in SP1 fraction and its corresponding downregulated targets from mRNA array list of upregulated genes (green color represents downregulated mRNAs in SP1; functional clustering of targeted downregulated mRNAs in SP1; red color represents upregulated microRNAs in SP1). (B) Similarly, downregulated microRNAs in SP1 were correlated with upregulated mRNA targets in SP1 (red color represents functional clustering of upregulated mRNAs in SP1; green color represents targeted downregulated microRNAs in SP1) (also see supplementary Excel sheet S2 available at http://rgcb.res.in/OncologyResearch.php).

