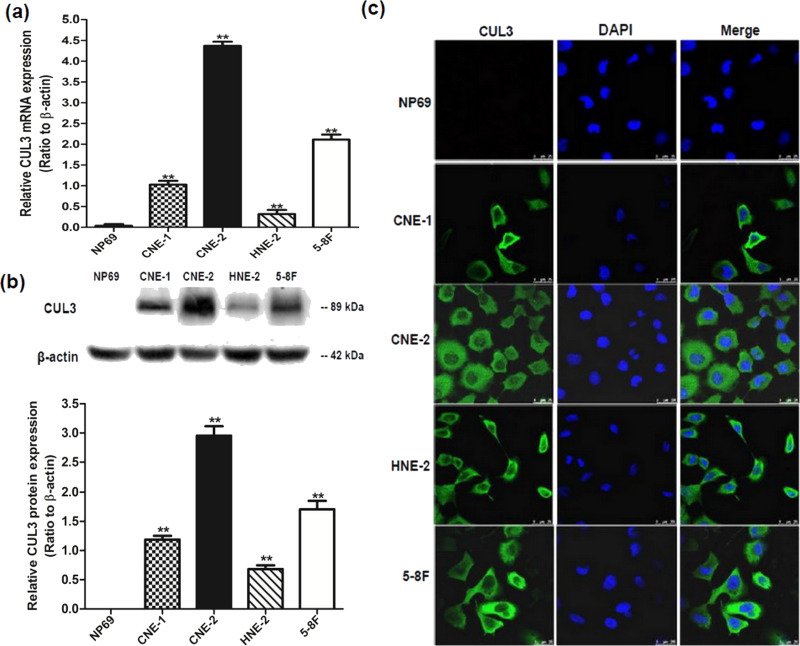
Figure 4.
Expression level of CUL3 in different NPC cell lines. (a) Relative CUL3 mRNA expression of different NPC cell lines (CNE-1, CNE-2, HNE-2, and 5-8F). **p < 0.05 versus the NP69 cells. (b) Relative CUL3 protein expression of different NPC cell lines (CNE-1, CNE-2, HNE-2, and 5-8F). **p < 0.05 versus the NP69 cells. (c) Immunofluorescence analysis of CUL3 expression. Original magnification: 1,000×; scale bar: 25 μm.

