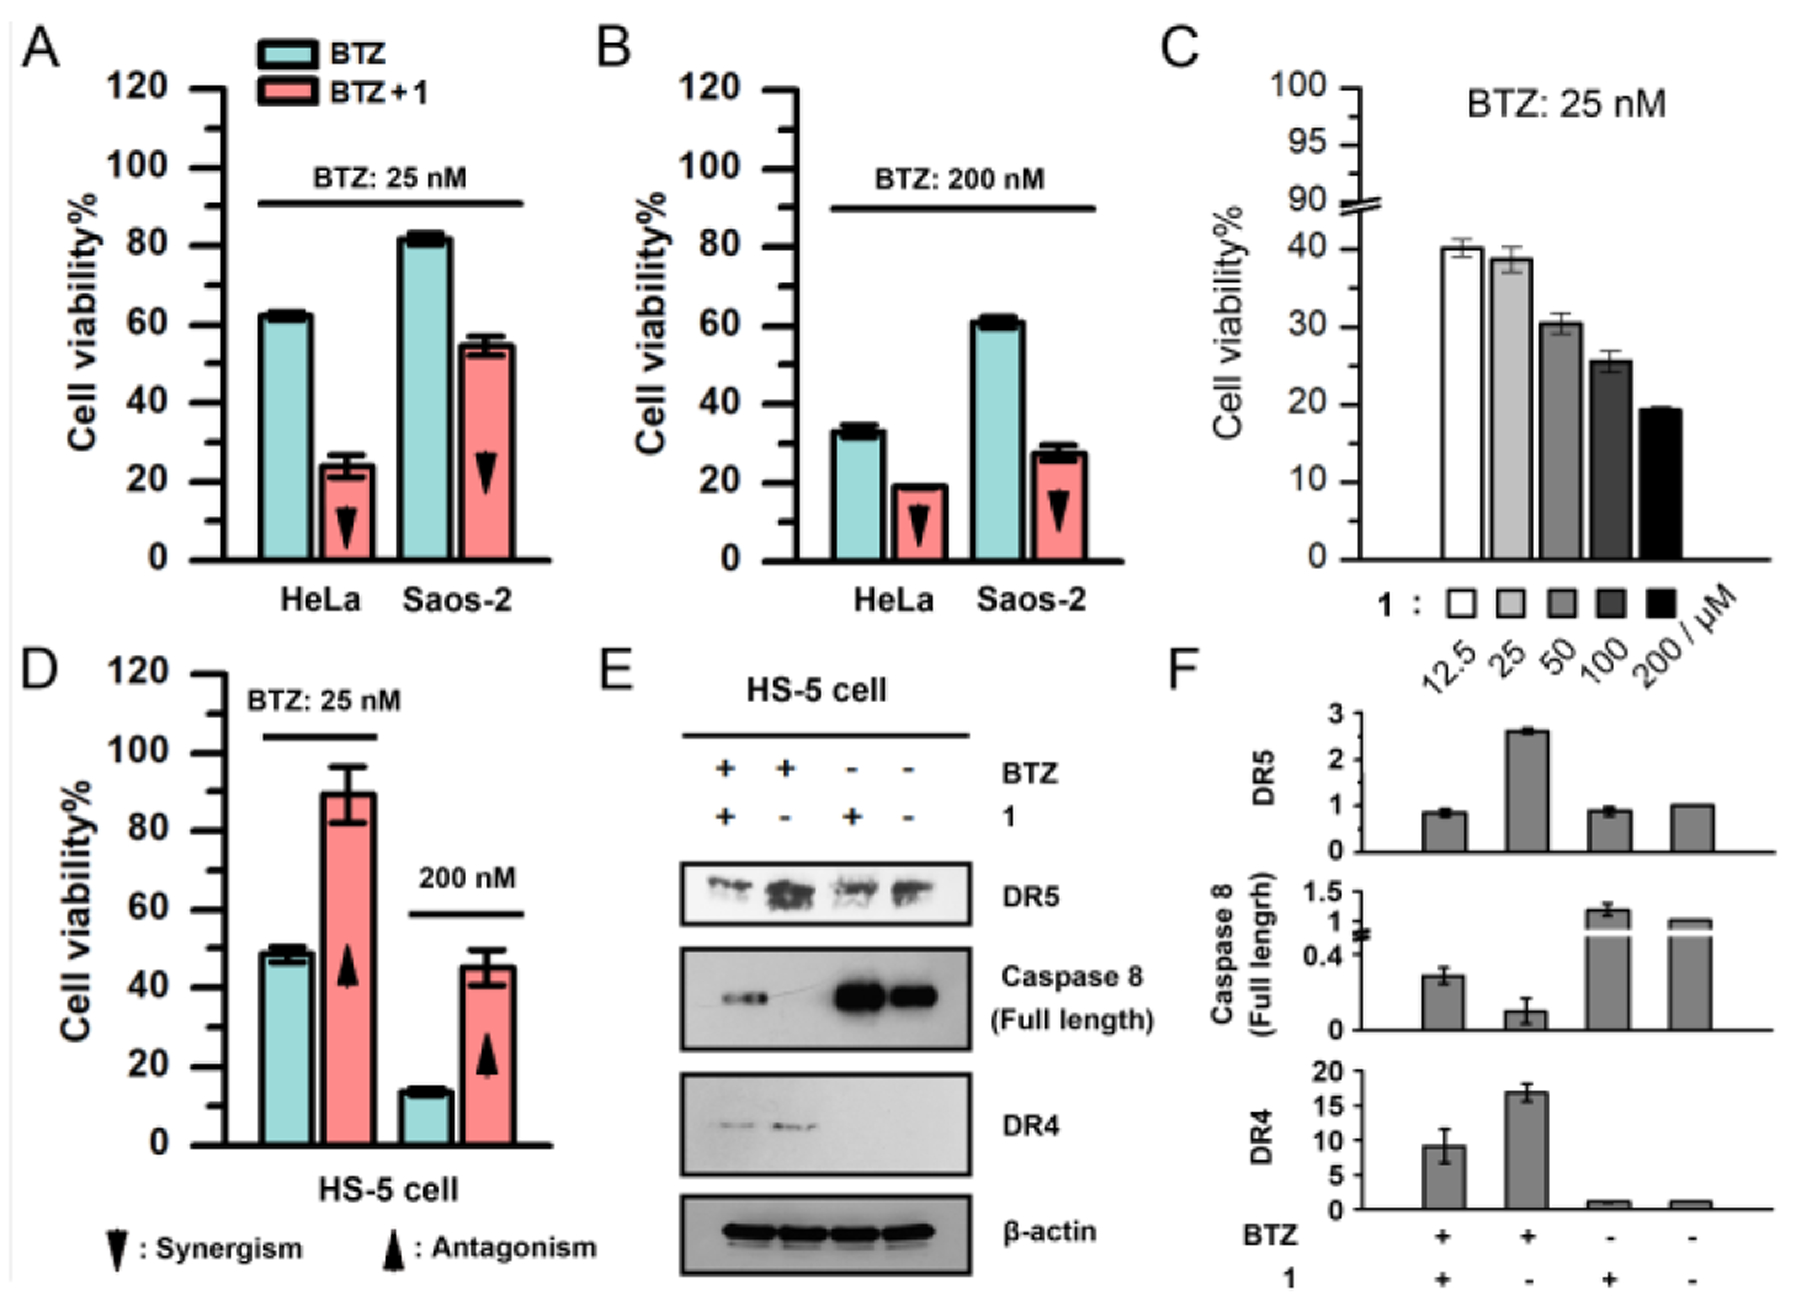
Figure 2.

Cell viabilities of (A, B) HeLa and Saos-2 cells incubated with (A) 25 nM and (B) 200 nM of BTZ or the mixture of BTZ and 1 (50 μM), (C) HeLa cells incubated with 1 of different concentrations in the presence of BTZ (25 nM), and (D) HS-5 cells incubated with 25 nM and 200 nM of BTZ or the mixture of BTZ and 1 (50 μM). (E) Western blot of DR5, full-length caspase-8 and DR4 in the HS-5 cells treated by PBS, 1 (50 μM), BTZ (100 nM), and the mixture of BTZ (100 nM) and 1 (50 μM) for 2 days. (F) The relative protein levels of DR5, full-length caspase-8 and DR4 in (E). The protein level in the control group is defined to be 1.0.
