
Figure 5.
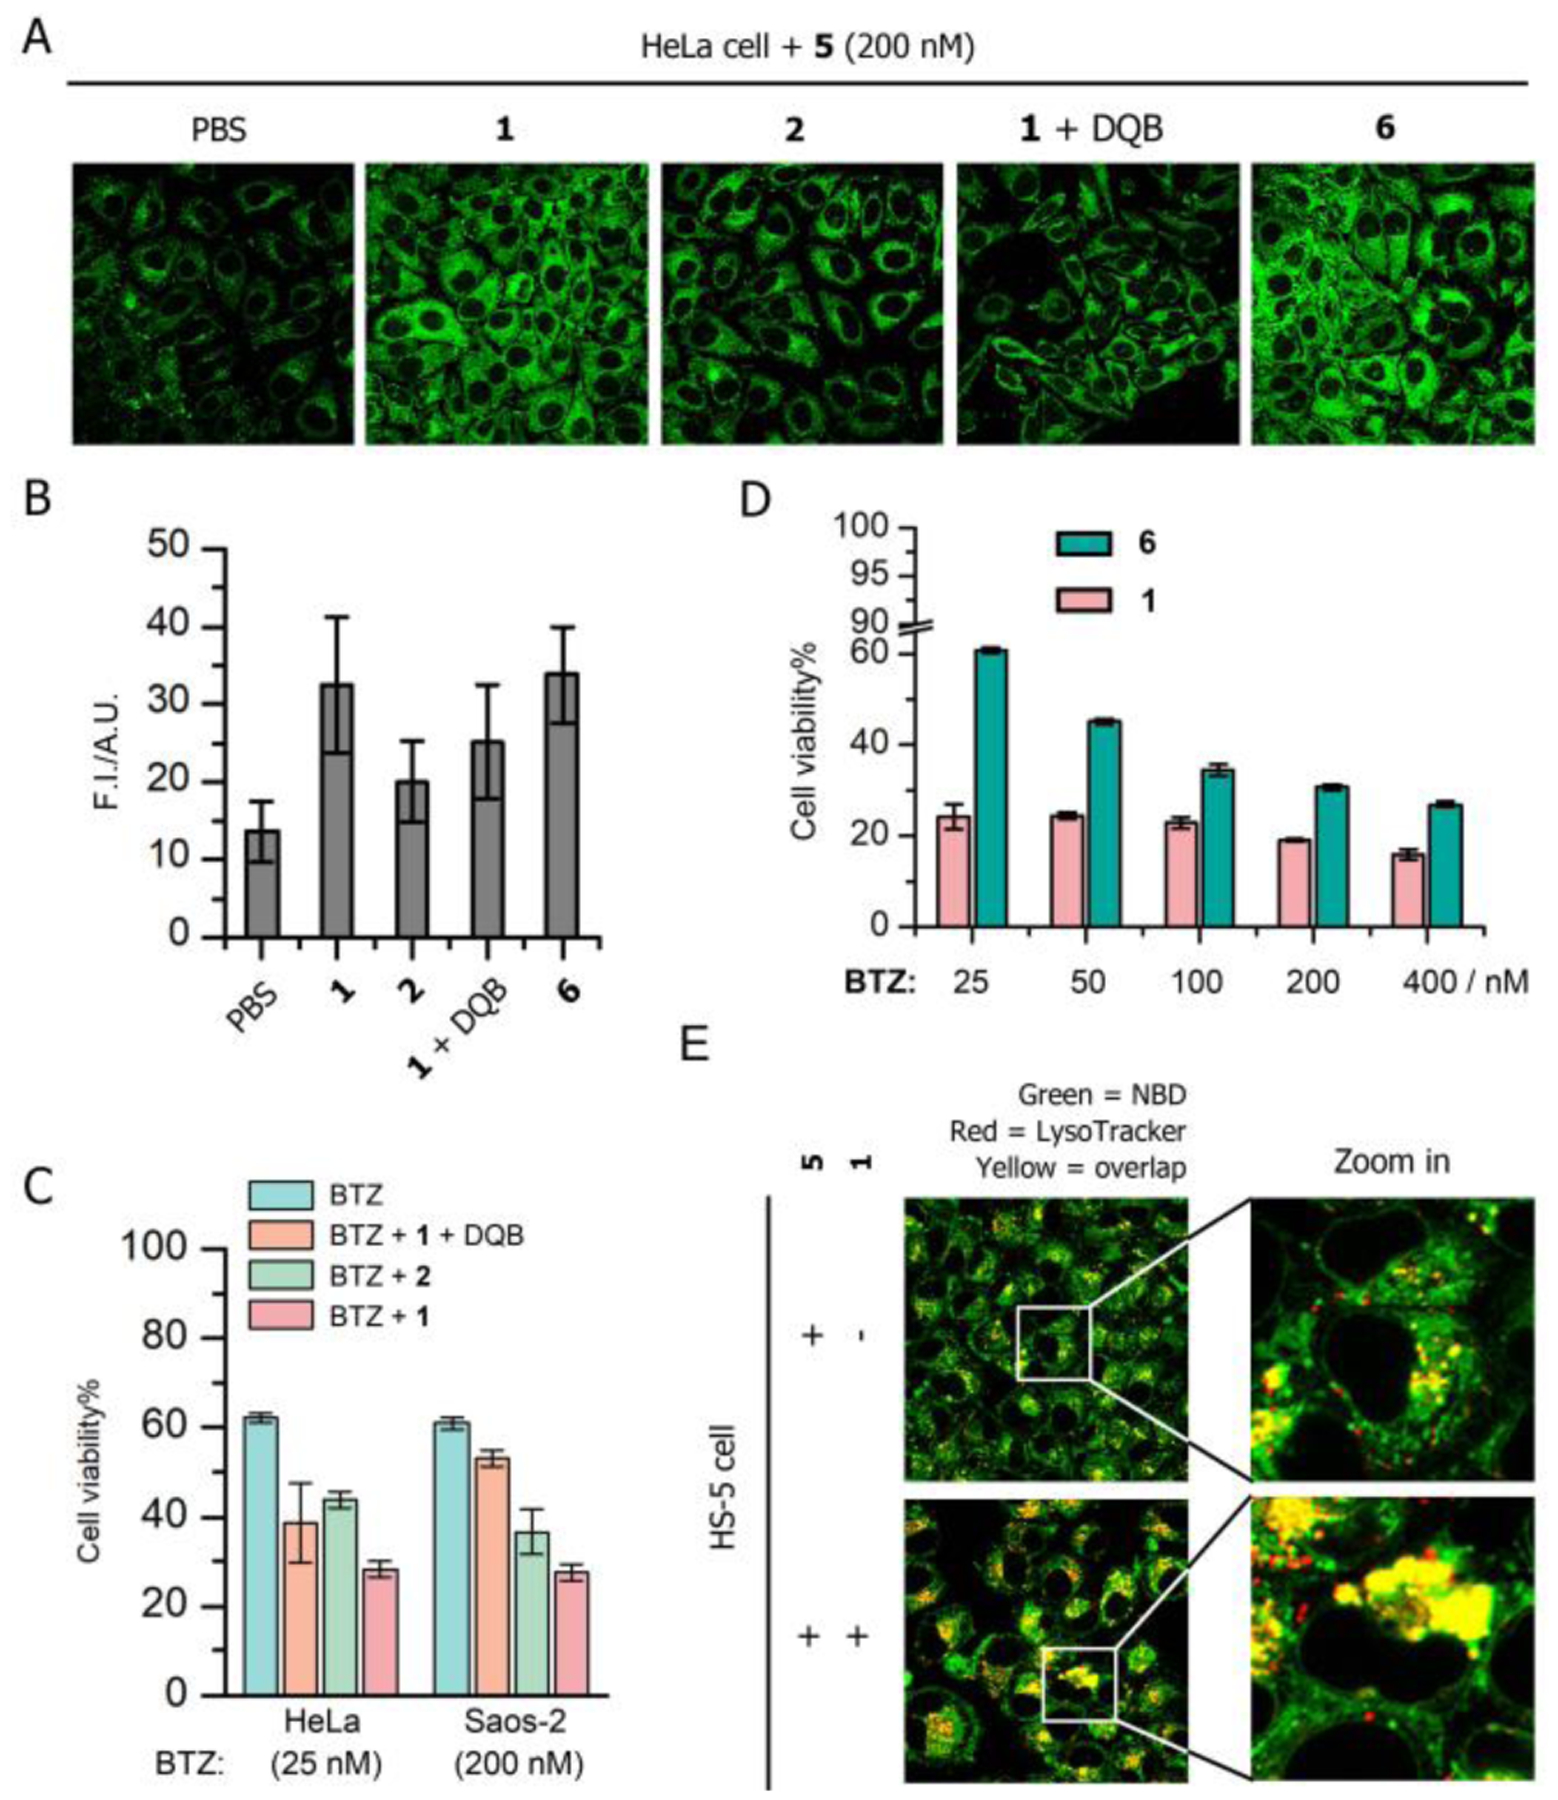
(A) Fluorescent images of HeLa cells incubated with 5 (200 nM, 4 h) in the presence of 50 μM 1, 2, the 1 mixed with DQB (25 μM) and 6 (50 μM). (B) Semi-quantification of the fluorescence of 5 in HeLa cells incubated with the condition of interest. (C) Cell viability of HeLa and Saos-2 cells incubated with BTZ (25 nM, 2nd day) in the presence of 50 μM 1, 2 and 1 mixed with DQB. (D) Cell viability of HeLa cells incubated with BTZ of different concentrations in the presence of 1 or 6. (E) Fluorescent images of HS-5 cells incubated with 5 (200 nM) and the mixture of 1 (50 μM) and 5 (200 nM).