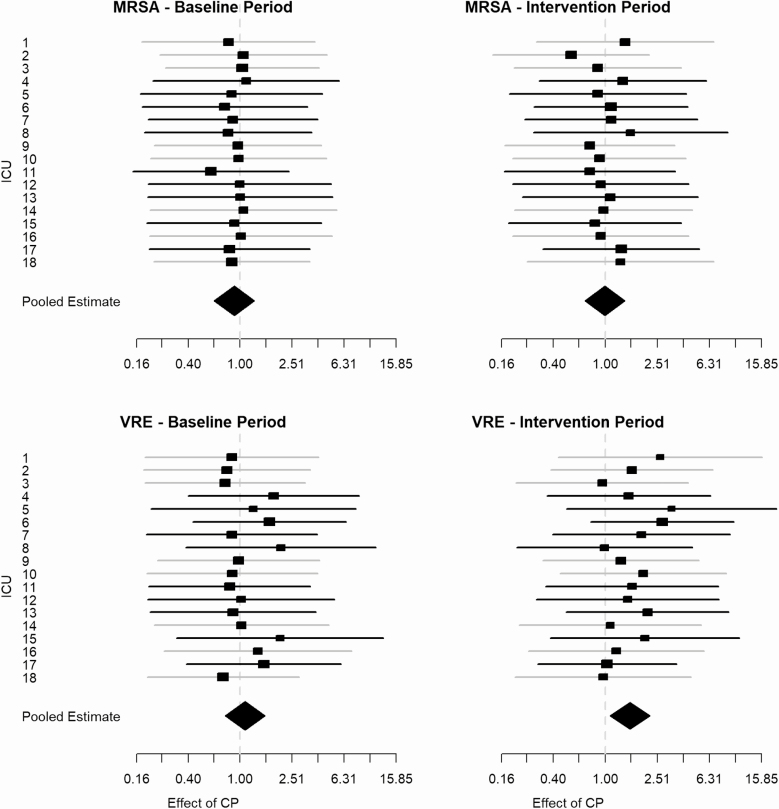
Figure 3.
Forest plots showing the estimated CPe, which represents the relative rate of transmissibility attributed to contact precautions compared with transmissibility attributed to no contact precautions. Results are organized by ICU and pooled (diamond shape) for MRSA (top) and VRE (bottom) during the baseline period (left) and intervention period (right). The gray lines represent the control ICUs, and the black lines represent the intervention ICUs. Abbreviations: CPe, effect of contact precautions; ICU, intensive care unit; MRSA, methicillin-resistant Staphylococcus aureus; VRE, vancomycin-resistant enterococci.

