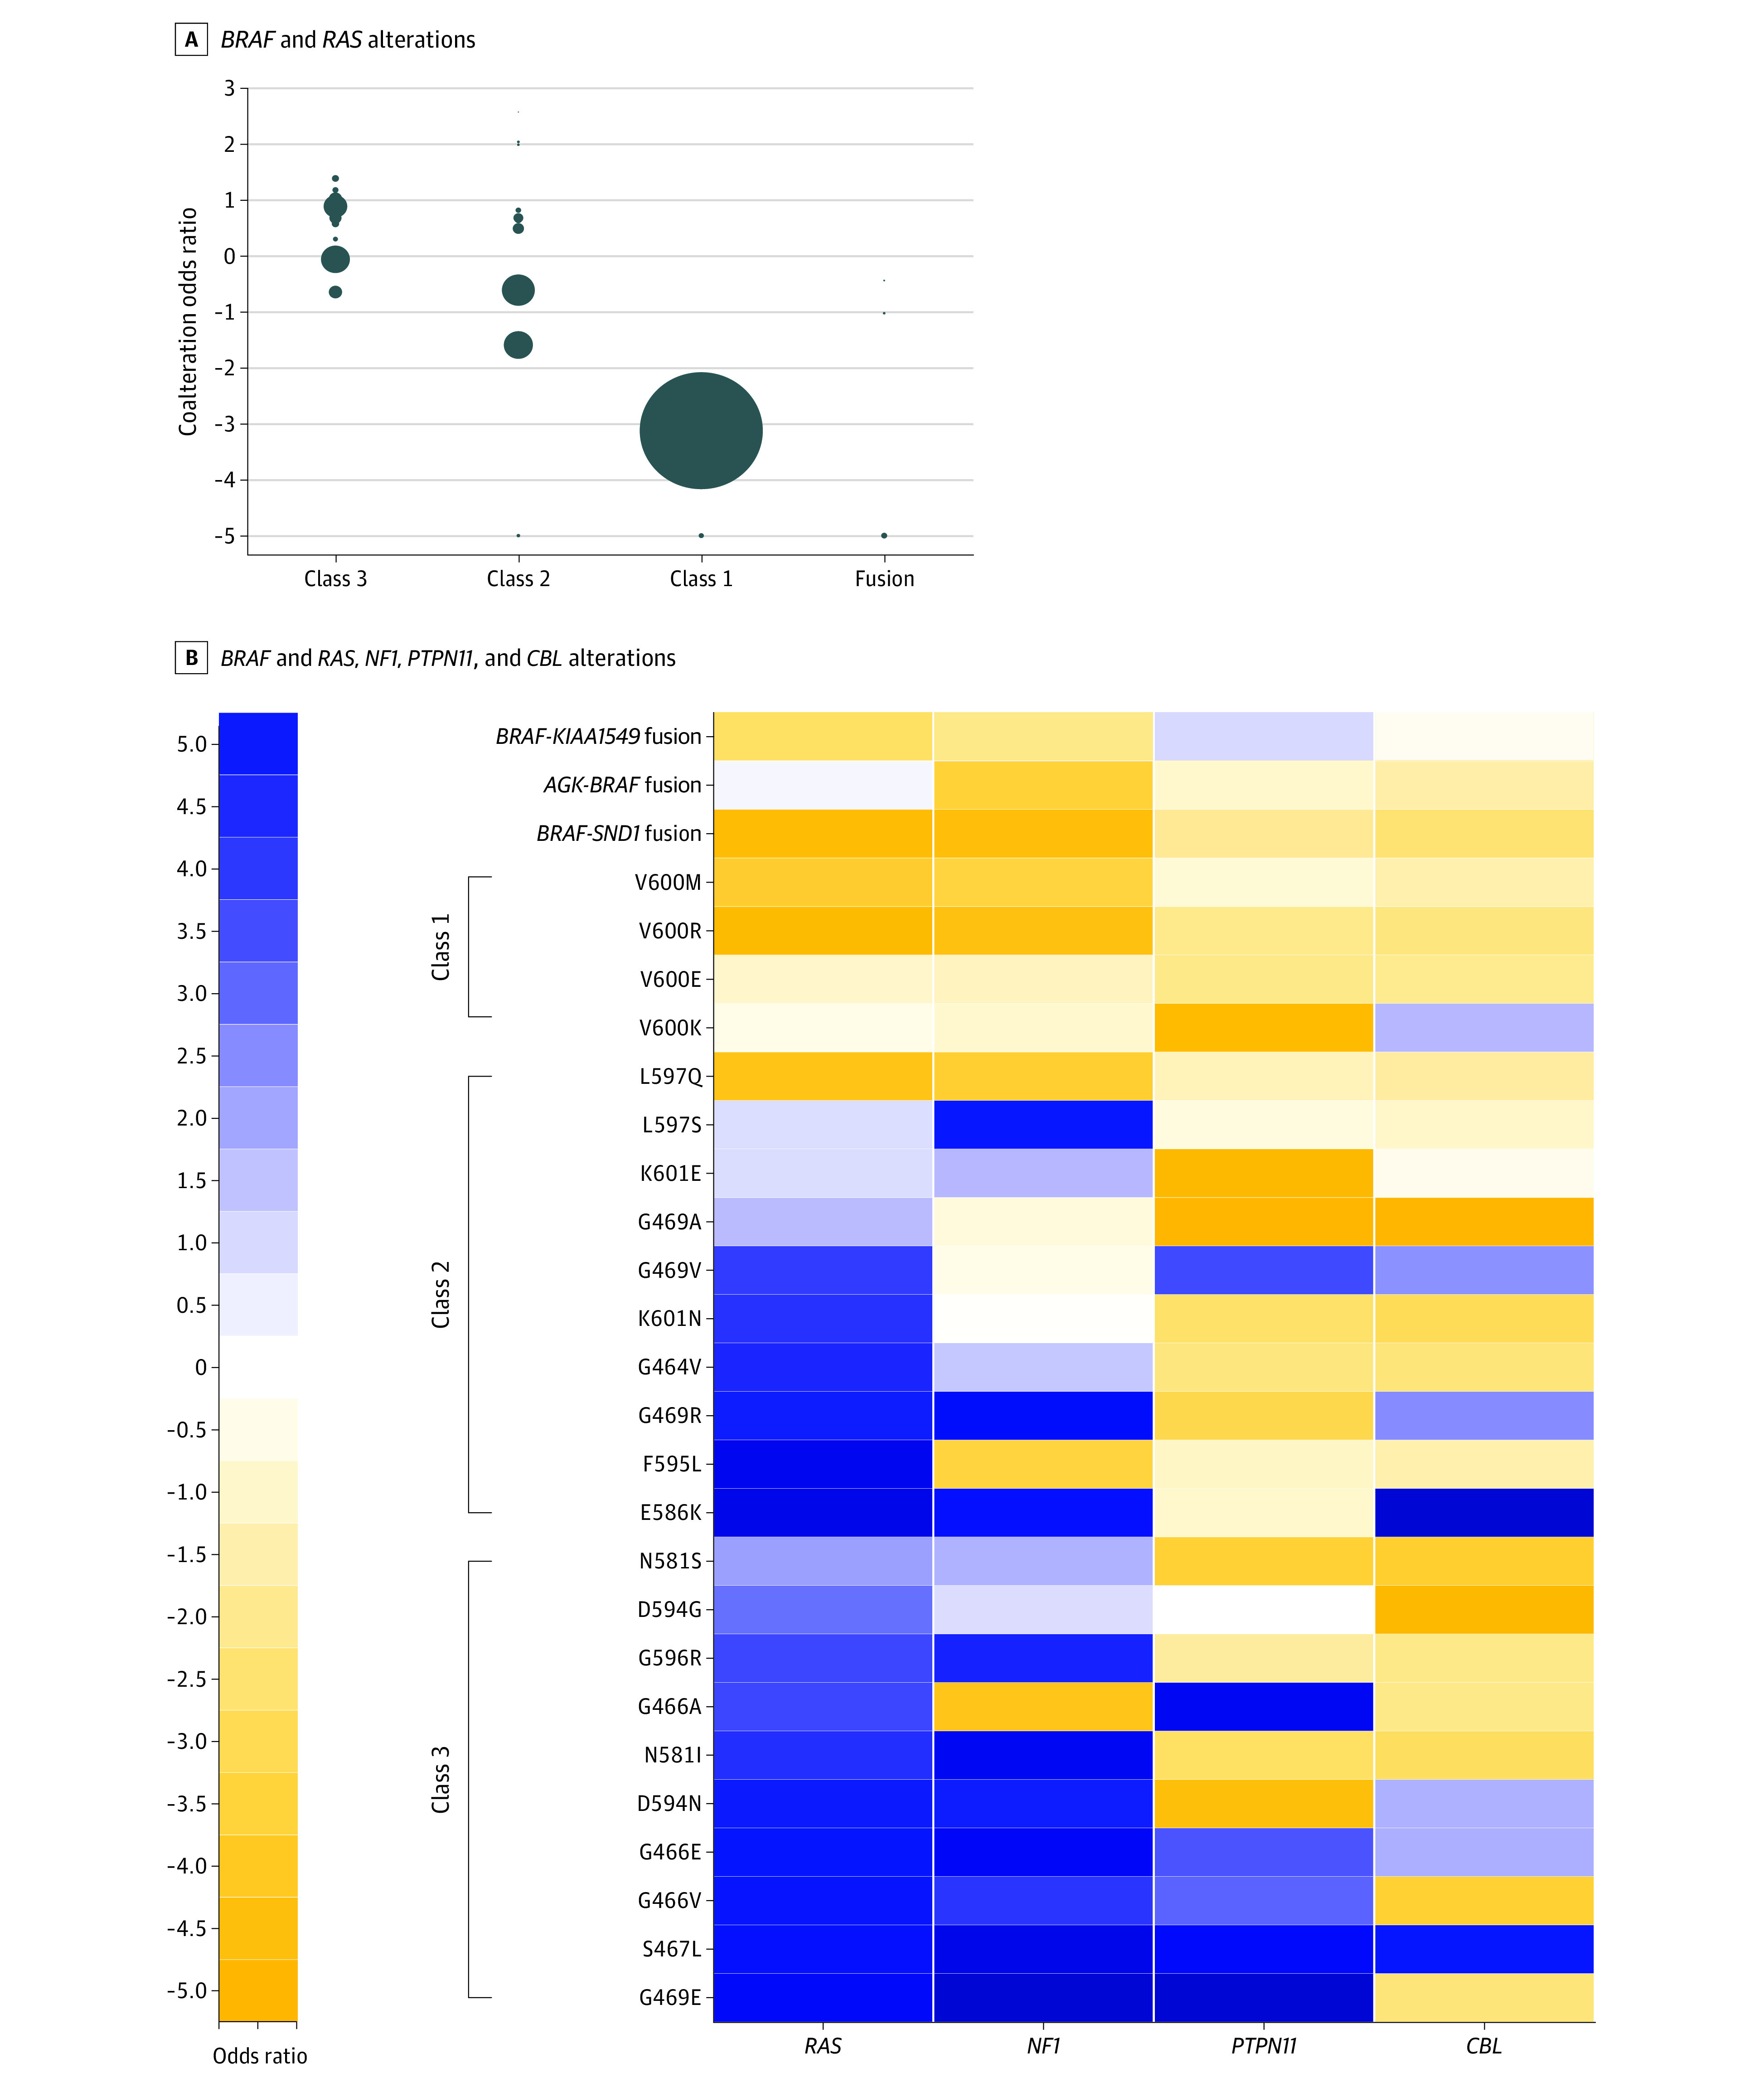
Figure 1. Summary of Coexisting Alterations of RAS and RAS Regulatory Genes for Individual BRAF Alterations.

A, Coalteration associations between BRAF alterations and RAS (KRAS, NRAS, and HRAS) alterations. Individual dots represent different alterations in the class. Size of dots represents numbers of patients with this alteration. B, Coalteration associations between BRAF alterations and RAS, NF1, PTPN11, and CBL alterations. Colors represent log2 odds ratio, and positive values were normalized to a −5 to 0 range, and negative values were normalized to a 0 to 5 range.
