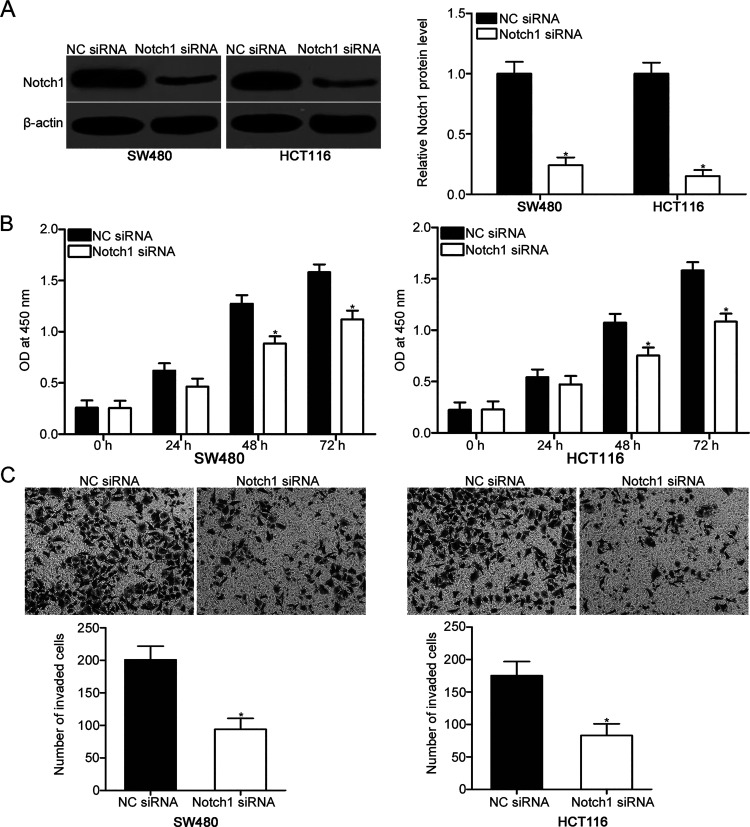
Figure 4.
Notch1 knockdown reduces the proliferation and invasion of SW480 and HCT116 cells. (A) Notch1 protein expression was measured in SW480 and HCT116 cells transfected with Notch1 small interfering RNA (siRNA) or NC siRNA using Western blot analysis. *p < 0.05 versus NC siRNA. (B) Cell proliferation activity was measured by CCK-8 assay in SW480 and HCT116 cells transfected with Notch1 siRNA or NC siRNA. *p < 0.05 versus NC siRNA. (C) Cell invasion capacity was analyzed with Matrigel invasion assay in SW480 and HCT116 cells transfected with Notch1 siRNA or NC siRNA. *p < 0.05 versus NC siRNA.

