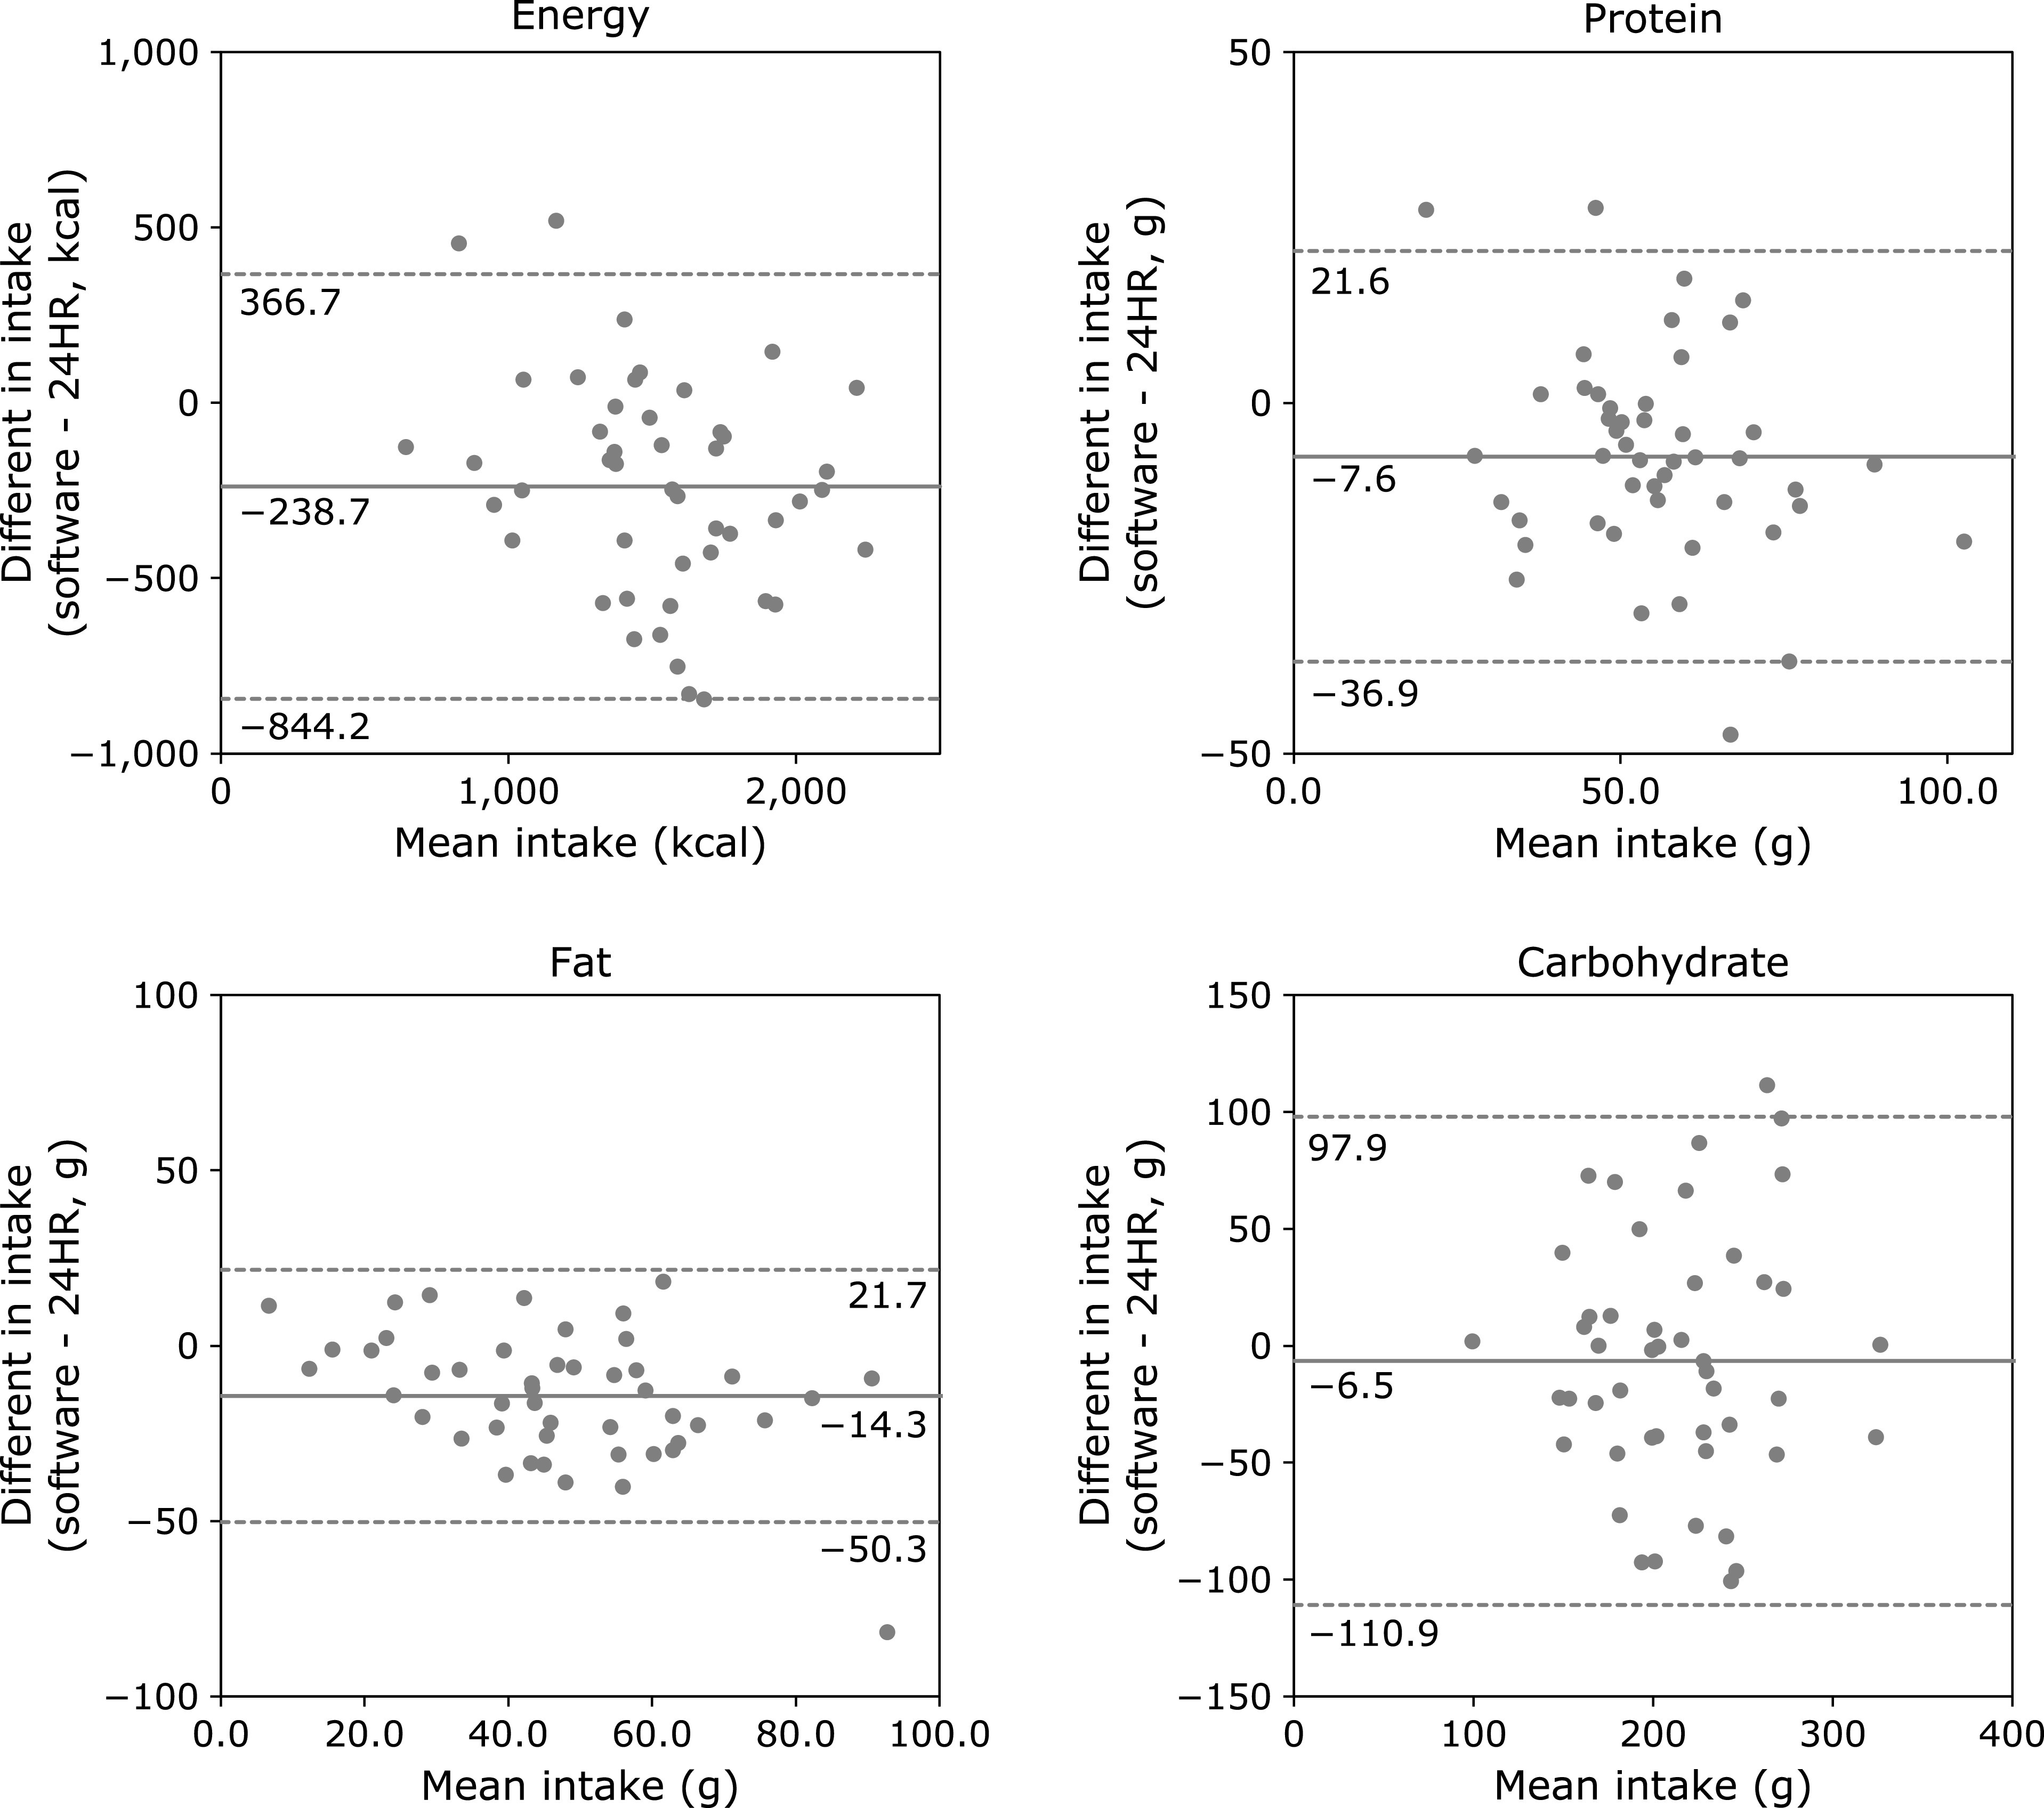
Fig. 1.

Bland–Altman plot of 24-h dietary recall (24HR) and computer software for energy, protein, fat, and carbohydrate intake. Differences in intake between methods are plotted against the mean of the two methods. The solid line indicates the bias (mean difference), and the dashed lines indicate the 95% limits of agreement (1.96 × SD).
