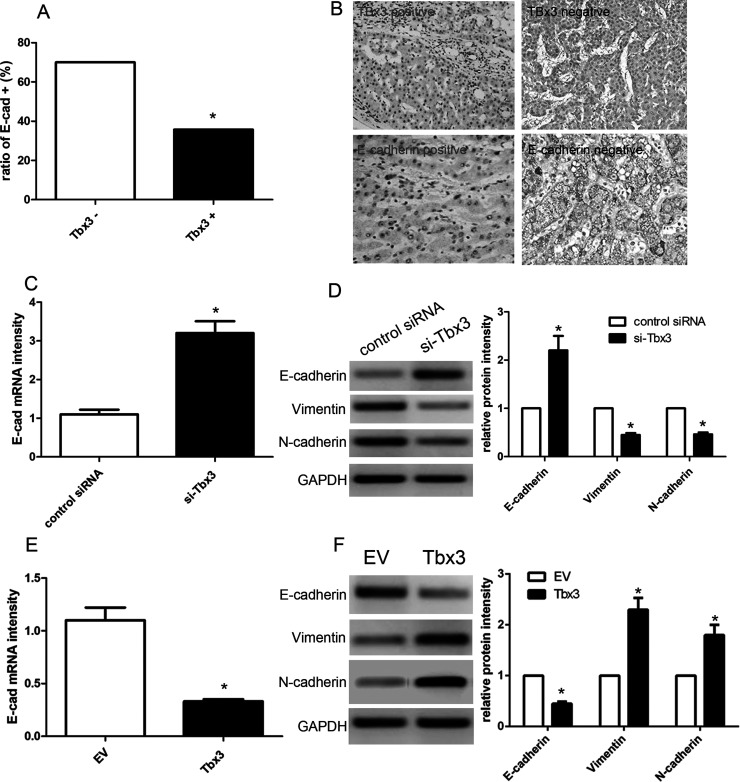
Figure 4.
Tbx3 is inversely correlated with E-cadherin in HCC. (A) The positive expression of E-cadherin in Tbx3-positive HCC specimens was significantly lower than that in Tbx3-negative cases. *p < 0.05, by Pearson chi-square test. (B) Representative immunohistochemical staining showed weak staining of E-cadherin (III) in Tbx3-positive-expressing tumor (I) and strong staining of E-cadherin (IV) in Tbx3-negative-expressing tumor (II). (C) Quantitative real-time reverse transcriptase polymerase chain reaction (qRT-PCR) analysis of E-cadherin mRNA expression in HCCLM3 cells with Tbx3 siRNA or scrambled siRNA transfection. n = 3; *p < 0.05, by t-test. (D) Tbx3 knockdown increased the level of E-cadherin protein and reduced the expression of vimentin and N-cadherin in HCCLM3 cells. n = 6; *p < 0.05, by t-test. (E) qRT-PCR analysis of E-cadherin mRNA expression in Hep3B cells with Tbx3 or empty vector (EV) lentiviruses infection. n = 3; *p < 0.05, by t-test. (F) Tbx3 overexpression decreased the expression of E-cadherin protein and upregulated the expression of vimentin and N-cadherin in Hep3B cells. n = 6; *p < 0.05, by t-test.

