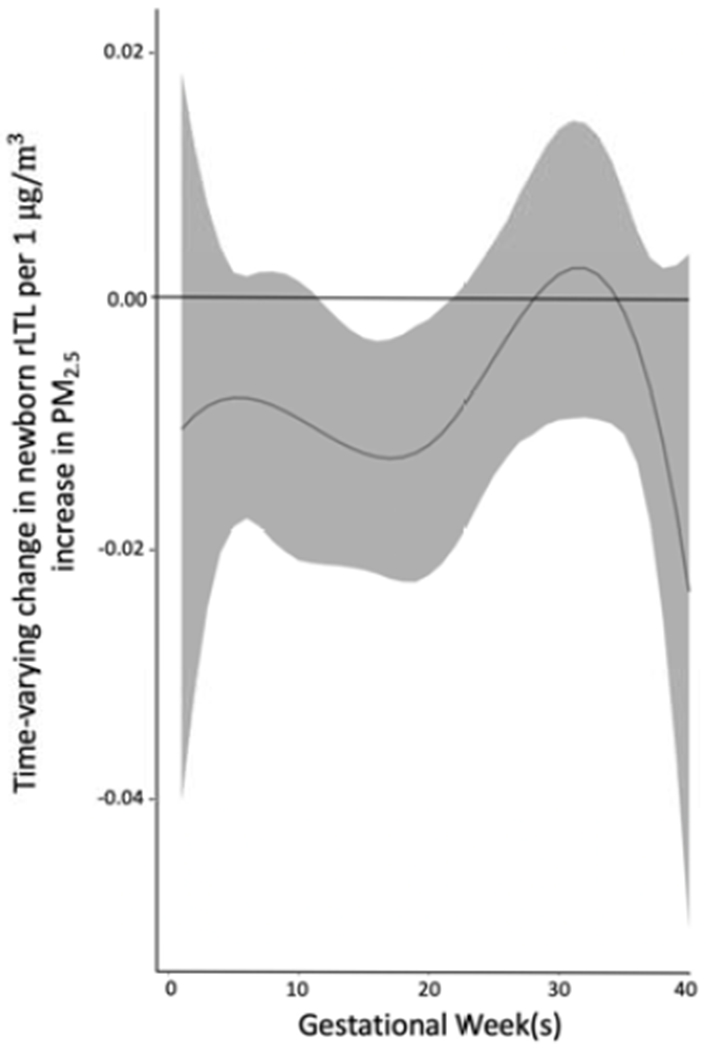
Figure 2. Associations between weekly PM2.5 levels over gestation and newborn relative leukocyte telomere length (rLTL).

This figure demonstrates the association between PM2.5 exposures over pregnancy and rLTL using a BDLIM assuming week-specific effects for the overall sample. The model was adjusted for maternal age, self-reported ethnicity, marital status, education level, maternal lifetime stress, antioxidant intake and infant sex. The y-axis represents the change in rLTL per 1 μg/m3 increase in PM2.5. The x-axis represents gestational age in weeks. The solid line shows the estimated change in rLTL while gray areas indicate 95% credible intervals (CIs). A sensitive window is identified for weeks 12-20 of gestation, where the estimated pointwise 95% CI does not include zero. BDLIMs also identified a cumulative estimated effect of PM2.5 over pregnancy on rLTL of −0.29 (95% CI −0.49 to −0.10) per 1μg/m3 increase in PM2.5.
