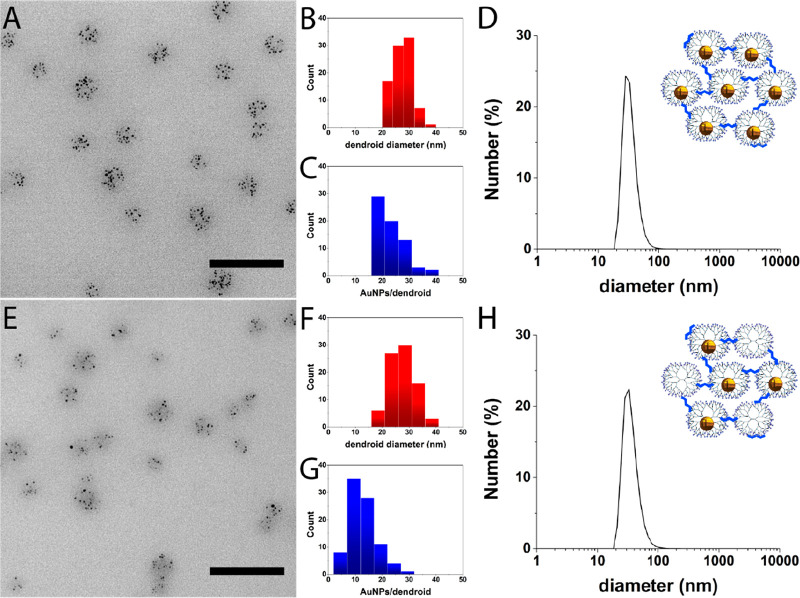
Figure 2.
Upper part (A–D) shows G7-Au dendroids (100% G7-Au), and lower part (E–H) shows G7-AuE dendroids (50% G7-E + 50% G7-Au). The left part shows representative TEM pictures of G7-Au (A) and G7-AuE (E) based dendroids. Scale bars represent 100 nm. The middle part shows histograms of G7-Au (B, C) and G7-AuE (F, G) based dendroids. The size of the G7-Au dendroids is 27 ± 3 nm (B, red), and the size of the G7-AuE dendroids is 28 ± 5 nm (F, red). The G7-Au and G7-AuE based dendroids contain 21 ± 6 AuNPs per dendroid (C, blue) and 12 ± 5 AuNPs per dendroid (G, blue), respectively. The right part shows number-averaged DLS plots of G7-Au (D) and G7-AuE (H) based dendroids, showing a size of about 35 nm for both dendroid types. The cartoons illustrate the type of dendroids characterized by DLS and TEM.

