
Figure 4:
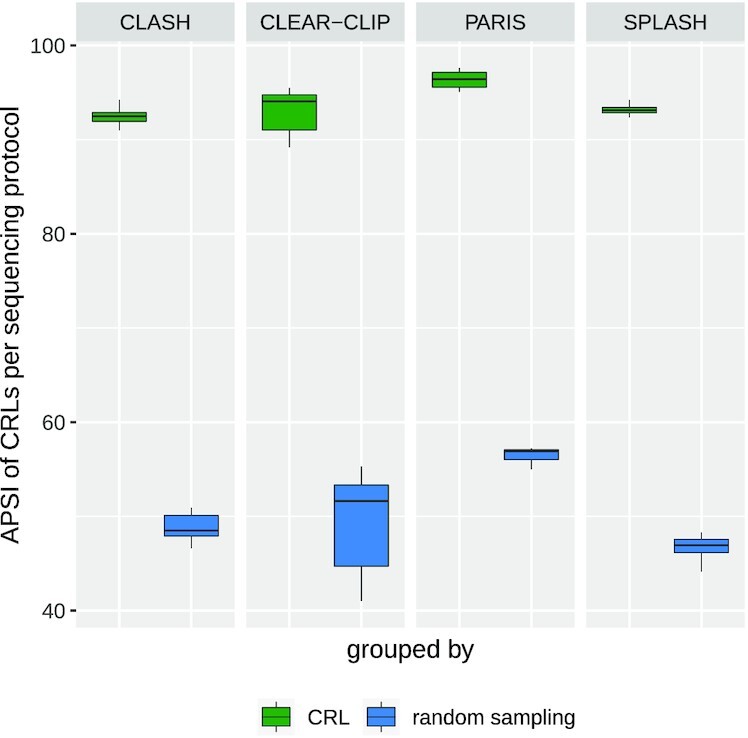
Box plots showing the average pairwise sequence identities (APSIs) among the member loci of the CRLs and those calculated from randomly sampled loci for each sequencing protocol. The loci sequences belonging to the CRLs show higher median of APSI than random sampling.