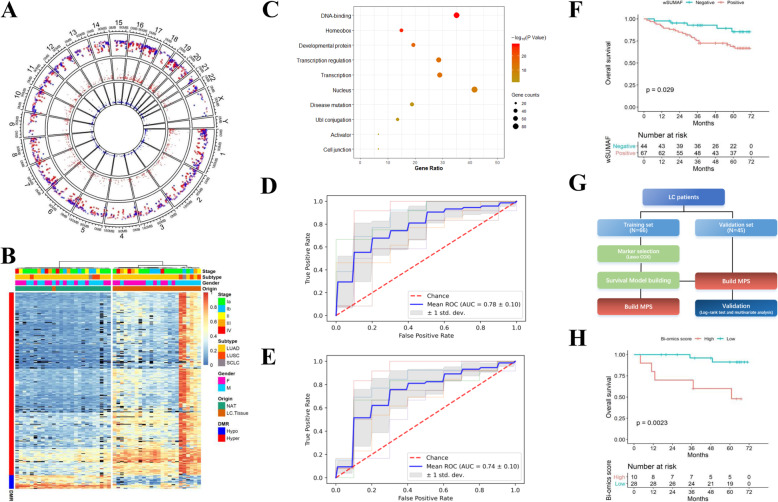
Fig. 2.
DNA methylation and multi-omics analysis. a Differentially methylated regions (DMRs) discovered by WGBS of LC tumor tissue and normal tissue adjacent to the tumour (NAT). Red points: Hypermethylated DMRs in LC tissues. Blue points: hypomethylated DMRs in LC tissues. From outer to inner circle: the first circle is the overview of DMRs, the second circle is the area statistics of hypermethylation regions (methy.diff> 0.2), and the third circle is the area statistics of hypomethylation regions (methy.diff<− 0.2). b Heatmap of the DMRs with hierarchical clustering. Block color represents the methylation β value and black represent N.A. values due to insufficient sequencing depth. c Functional annotation of the genes associated with the 293 hypermethylated DMRs by gene ontology (GO) terms using DAVID. d Predictive models based on combined mutation score, selected DMR, and serum CEA levels in tri-omics profiled samples. e Predictive models based on mutation score and selected DMR to distinguish LC from BLN plasma. f Kaplan-Meier plot on mutation-based LC prognostic model in relation to OS in the whole dataset. g Flow chart of methylation-based survival analyses on LC patients. h Kaplan-Meier plot on multi-omics-based prognostic model in relation to OS in the testing set

