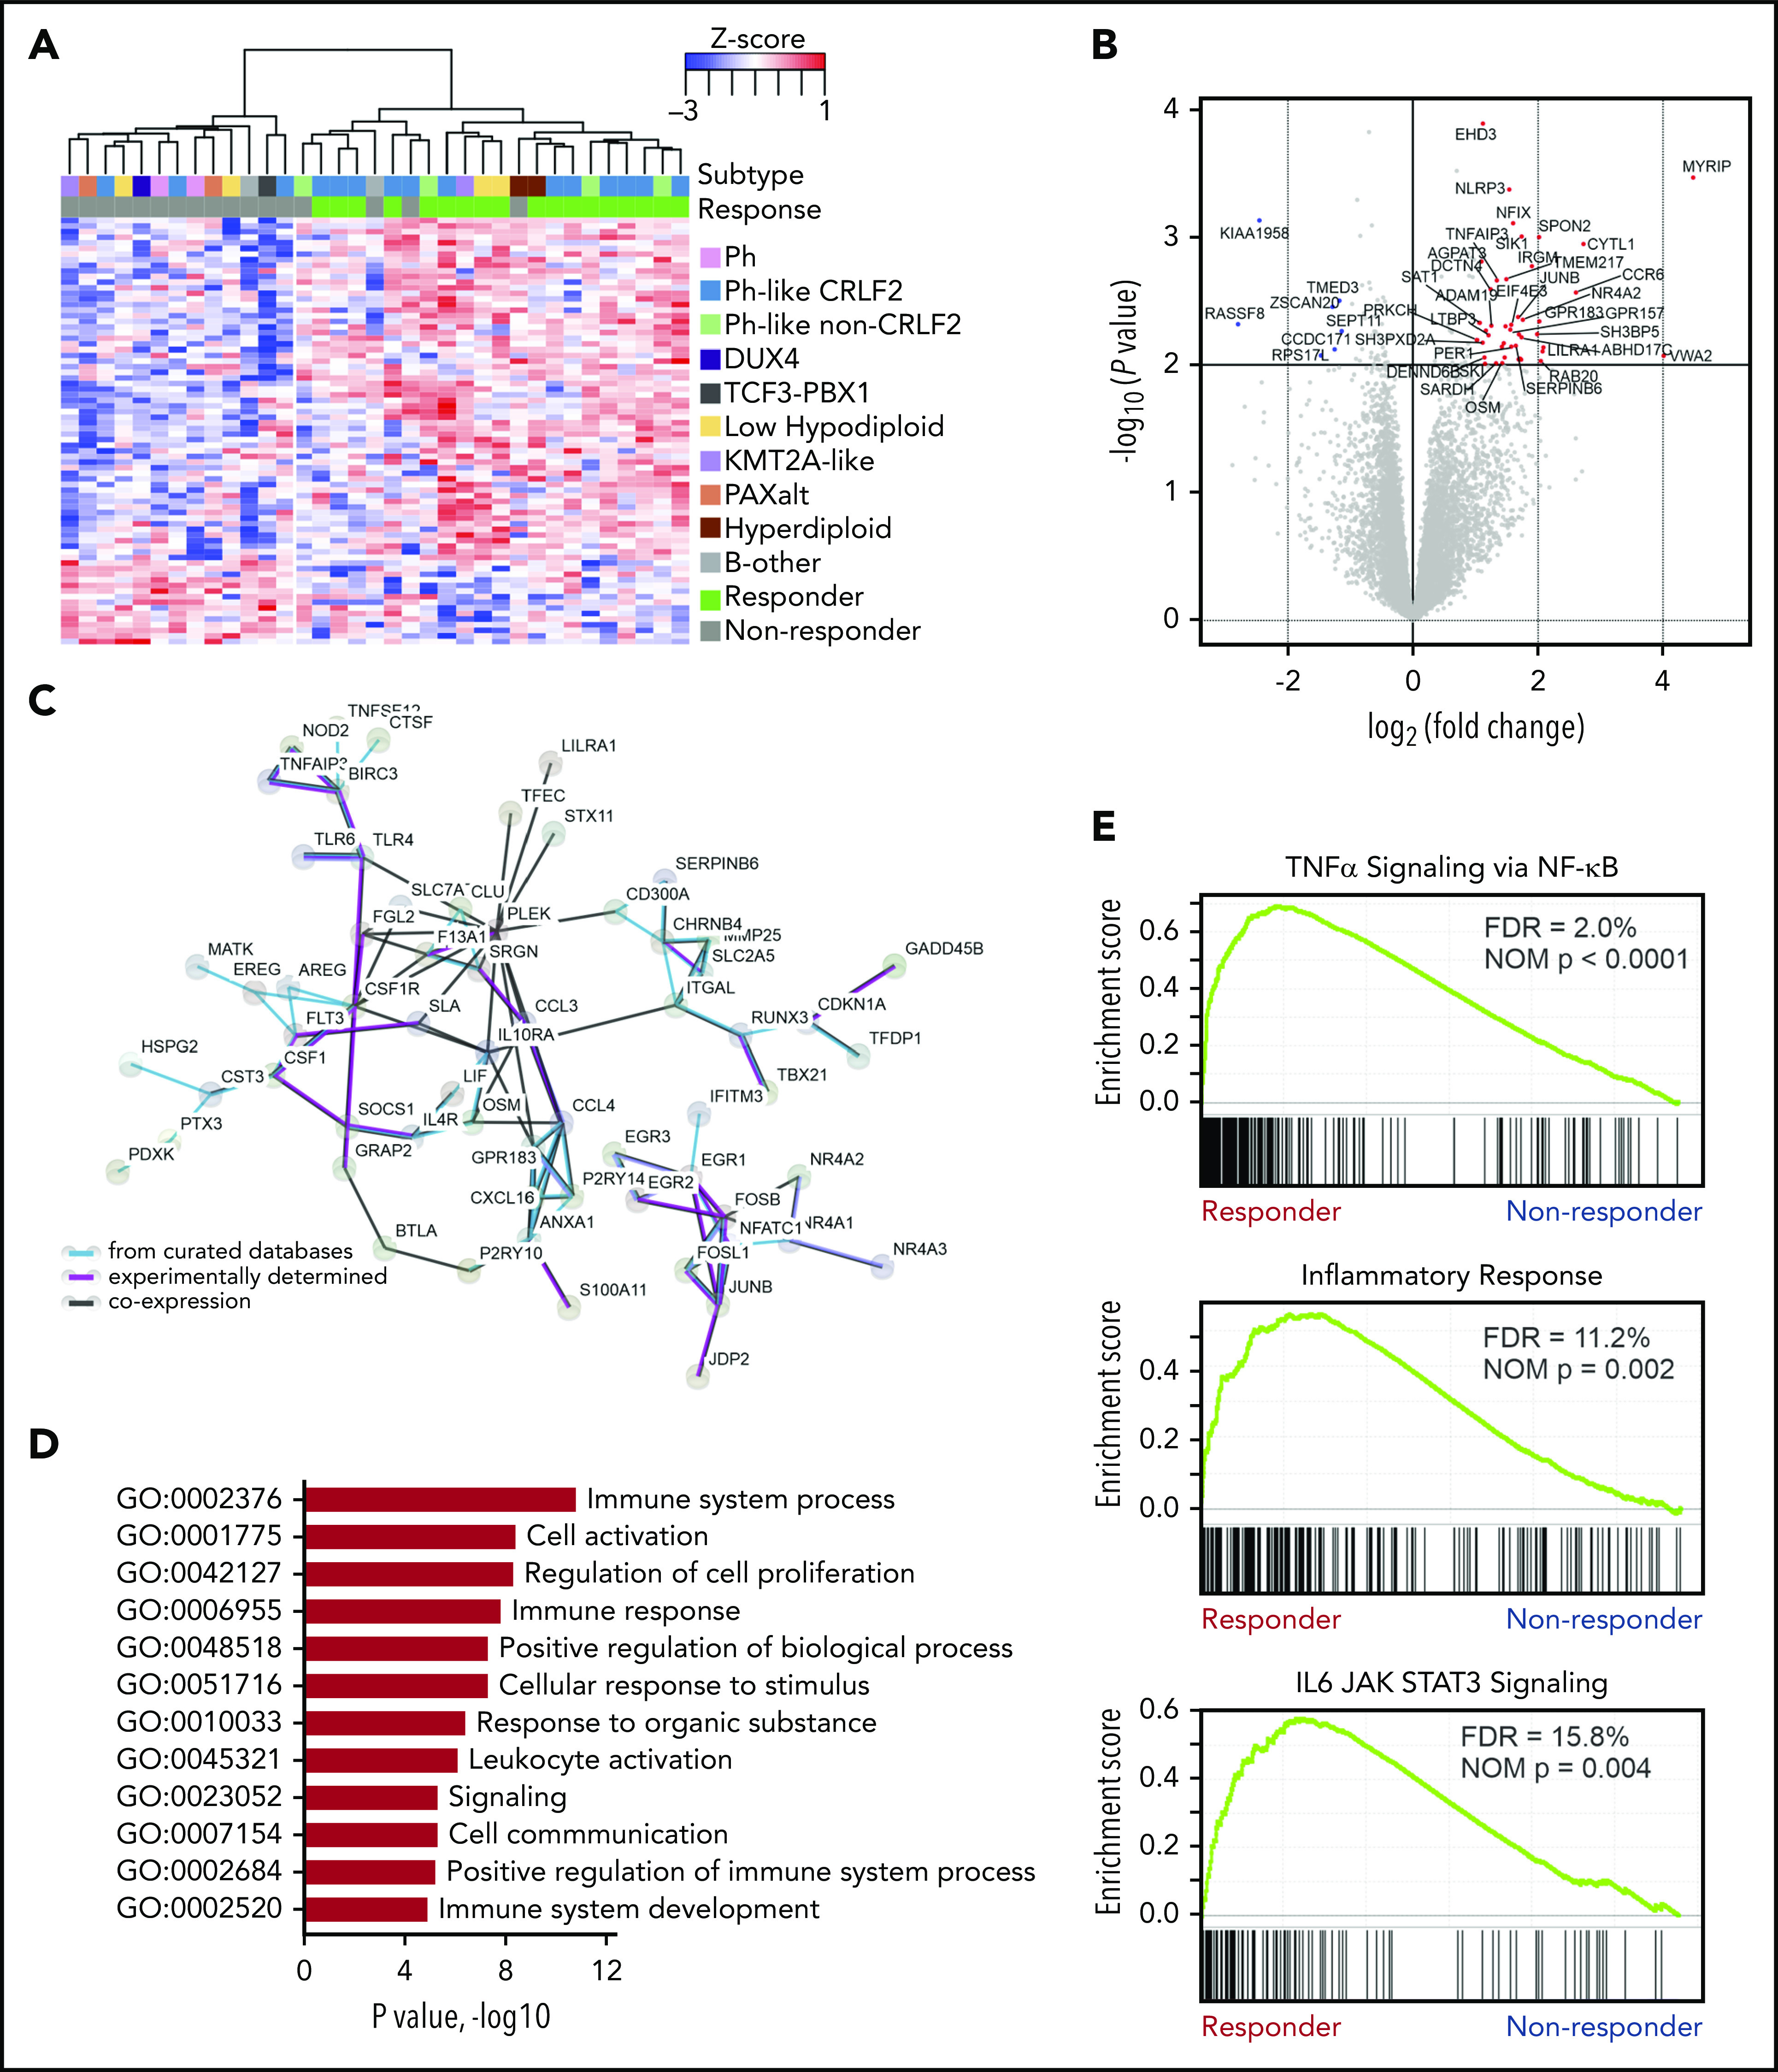
Figure 2.

Heightened immune response signature in blinatumomab responders. (A) Supervised hierarchical clustering of differential gene expressions showing upregulated genes in responders (n = 227 genes) and nonresponders (n = 118 genes). (B) Differential gene expression in responders. Protein coding genes with log counts per million (CPMs) >0 displayed. P < .01 and log2 fold-change >1 (red dots); P < .01 and log2 fold-change <1 (blue dots). (C) STRING (Search Tool for Retrieval of Interacting Genes/Proteins) protein-protein interaction network of upregulated genes (n = 227) in responders. The minimum required interaction score was set to 0.4, and the disconnected nodes were removed. (D) Enrichment of Gene Ontology (GO) pathways in responders. (E) Significantly enriched gene set enrichment analysis (GSEA) gene sets in responders. FDR, false discovery rate; NOM, nominal; TNFα, tumor necrosis factor α.
