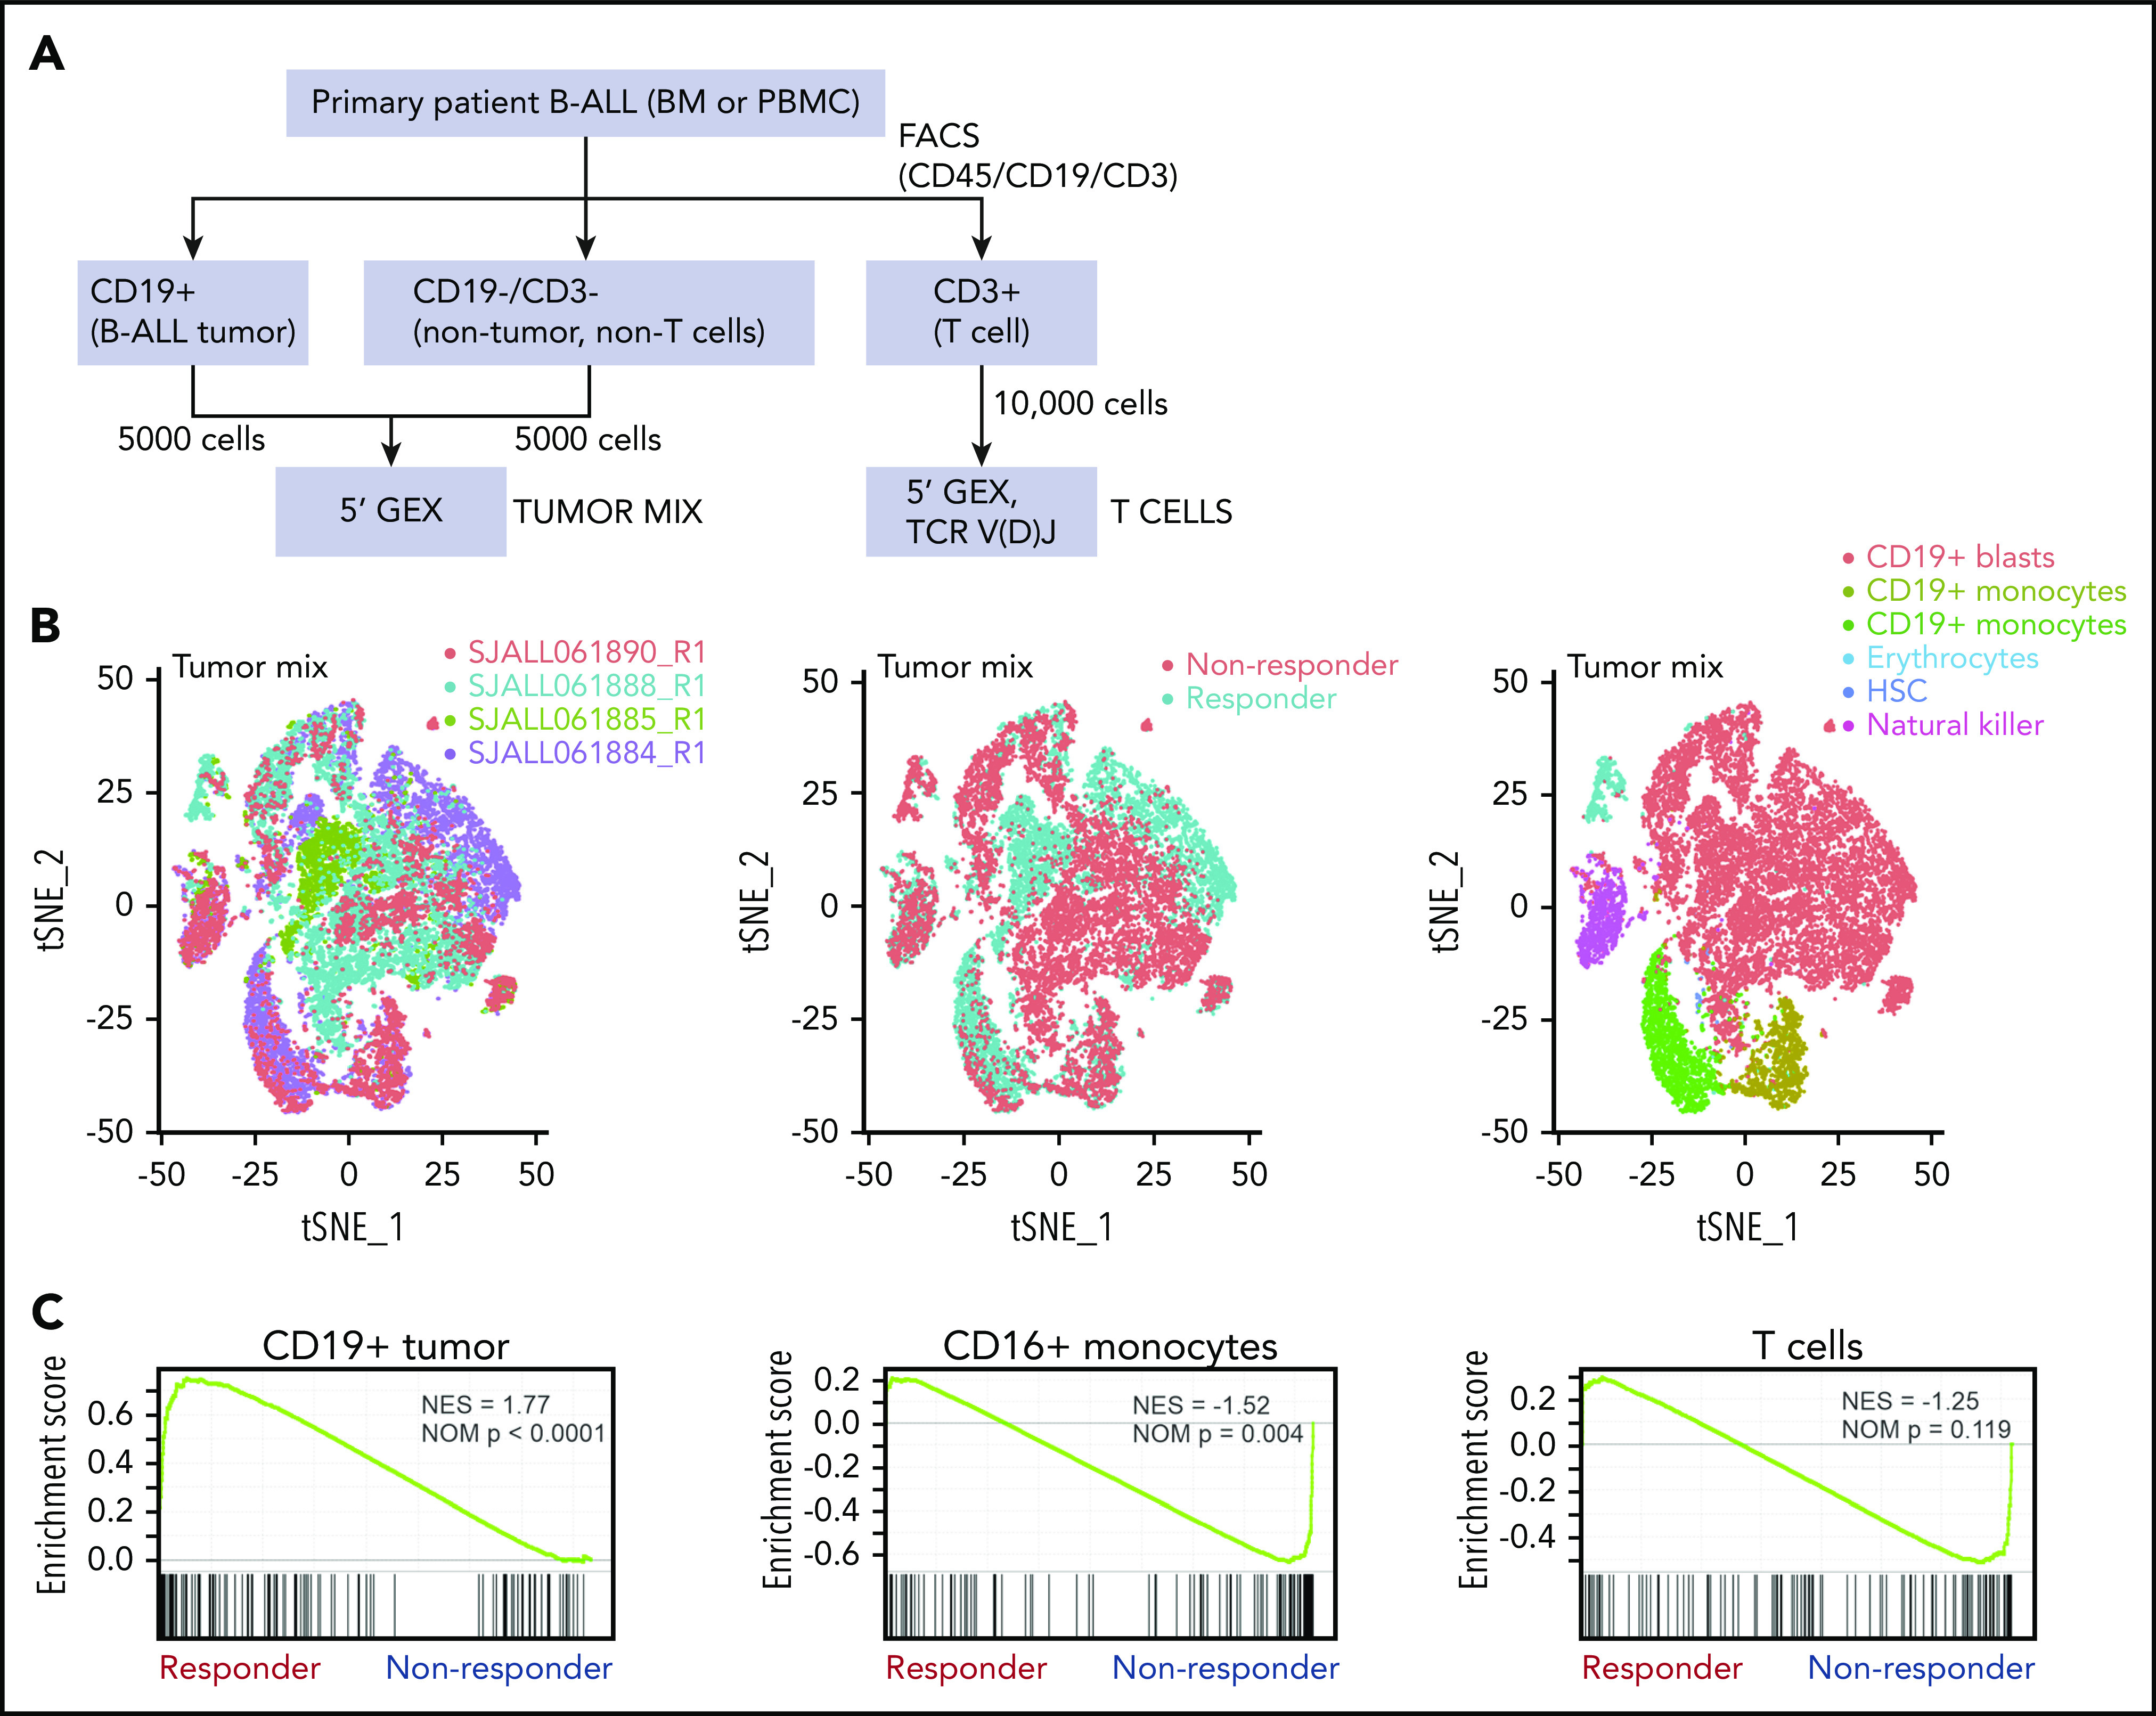
Figure 3.

Single-cell analysis of tumor mix cells. (A) Workflow for identifying tumor cells, T cells, and nontumor non–T cells for single-cell analysis by 10× Genomics in 2 responders, 2 nonresponders, and 1 postblinatumomab relapse sample. (B) tSNE plots of tumor mix cells showing 2 responders and 2 nonresponders visualized by sample, responder/nonresponder, and cell type. SJALL061890_R1 (n = 4512 cells), SJALL061888_R1 (n = 10 129 cells), SJALL061885_R1 (n = 4470 cells), and SJALL061884_R1 (n = 6275 cells). (C) GSEA of 10× Genomics 5′ gene expression of tumor mix cells showing enrichment of blinatumomab responder signature identified in bulk RNA-seq in CD19+ tumor cells from responders. BM, bone marrow; FACS, fluorescence-activated cell sorting; HSC, hematopoietic stem cell; NES, normalized enrichment score; NOM, nominal; PBMC, peripheral blood mononuclear cell; tSNE, t-distributed stochastic neighbor embedding.
