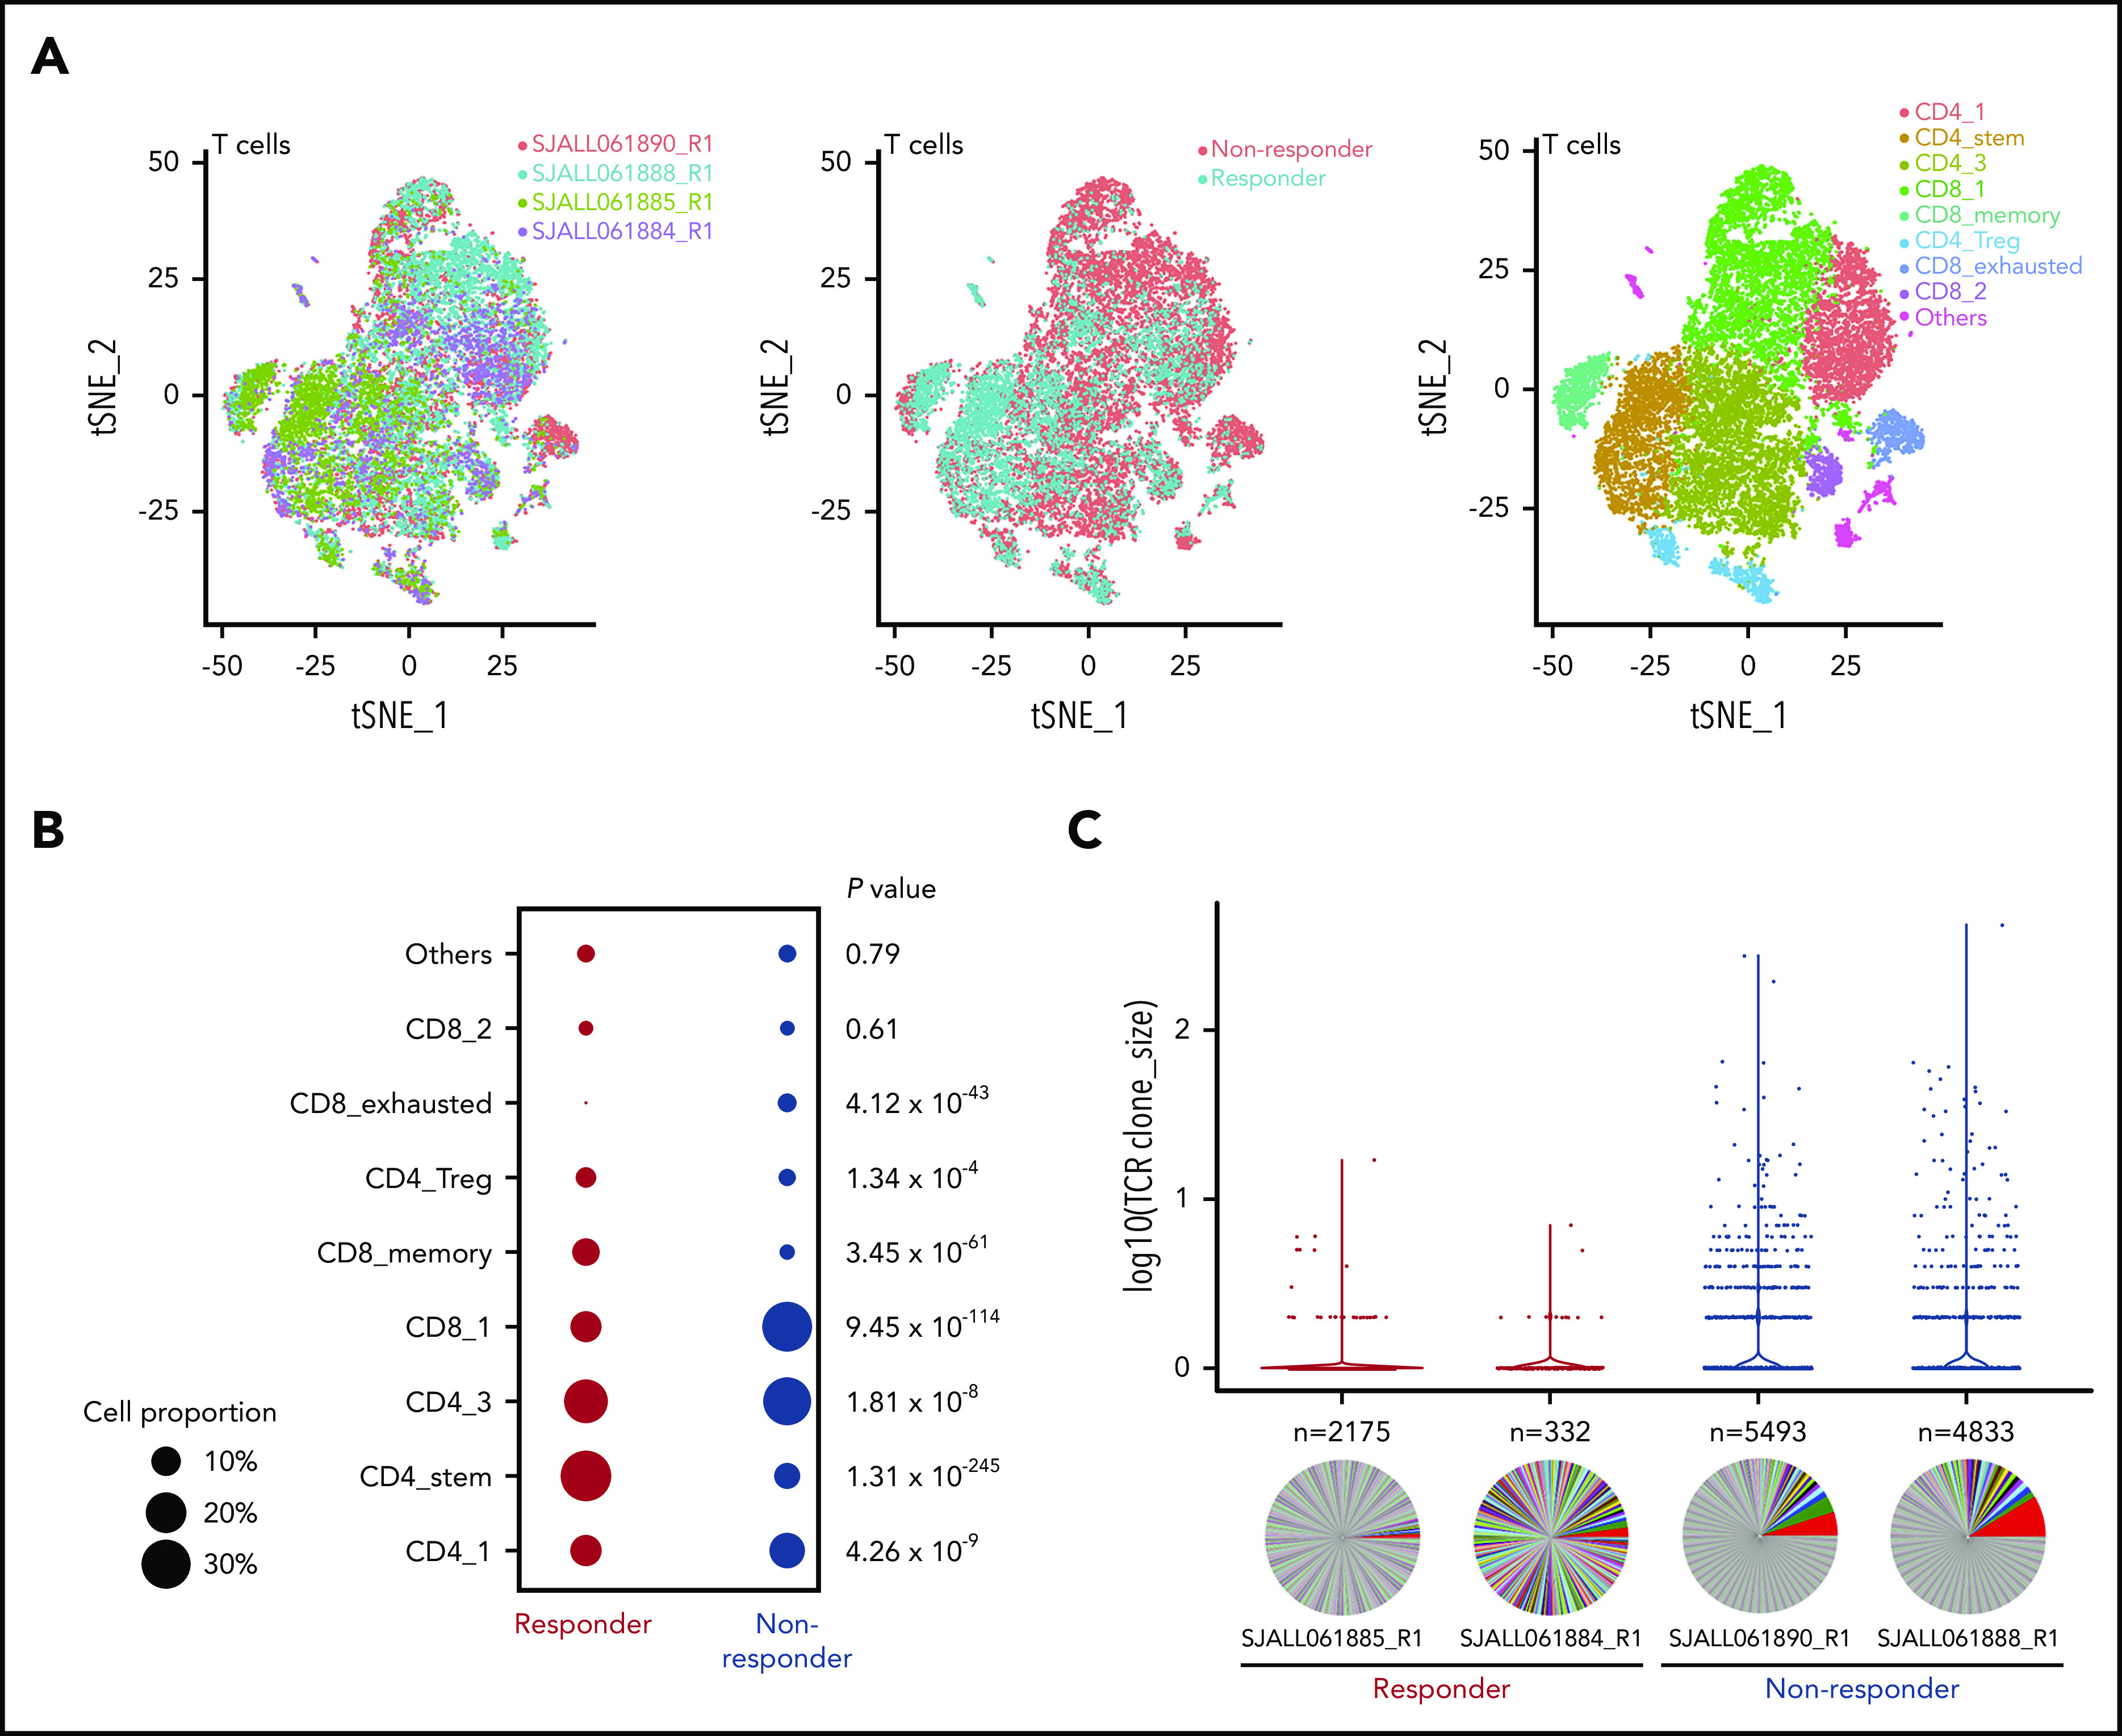
Figure 4.

Single-cell analysis of T cells. (A) t-distributed stochastic neighbor embedding (tSNE) plots of CD3+ T cells showing 2 responders and 2 nonresponders visualized by sample, responder/nonresponder, and T-cell type. SJALL061890_R1 (n = 7814 cells), SJALL061888_R1 (n = 10 807 cells), SJALL061885_R1 (n = 3557 cells), and SJALL061884_R1 (n = 1979 cells). (B) Proportion of different T-cell subsets present in responders compared with nonresponders. P value determined using Fisher’s exact test. (C) T-cell receptor (TCR) clonal expansion in responders and nonresponders. Clone size is shown on the y-axis. The number of different clones identified in each case is indicated above the pie chart. Pie charts demonstrate clonal diversity. Responders had restricted clonal expansion and increased diversity. Treg, regulatory T cell.
