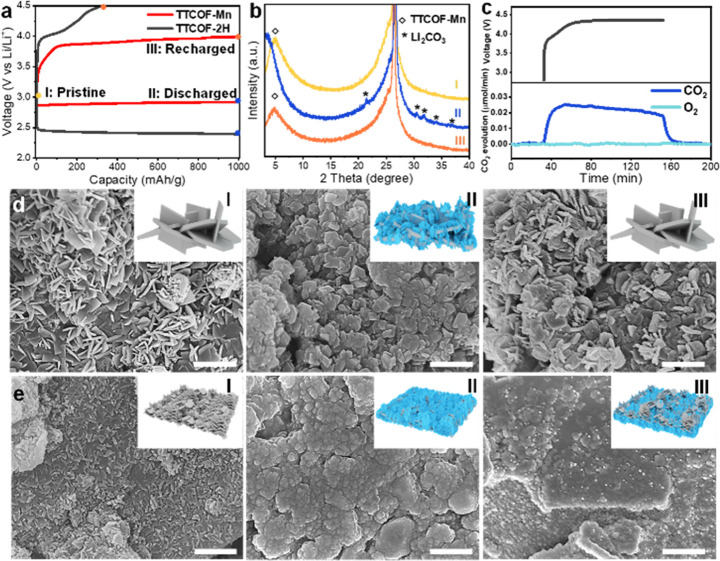
Figure 3.
Product characterizations of battery reactions. (a) Discharge–charge curves of TTCOF-Mn and TTCOF-2H cathode catalysts with a fixed capacity of 1000 mAh/g and a voltage range of 2.0–4.5 V vs Li/Li+ with three selected stages of pristine (I), discharge to 1000 mAh/g (II), and recharge back (III). (b) XRD patterns of TTCOF-Mn cathode catalysts at different stages in (a). (c) DEMS test during charging of the Li-CO2 battery with TTCOF-Mn cathode catalyst. SEM images of (d) TTCOF-Mn cathode catalyst and (e) TTCOF-2H cathode catalyst at different stages in (a), scale bar: 1 μm. The inset in each SEM image represents the schematic illustration of the morphological change of the cathode catalysts.

