
Figure 2.
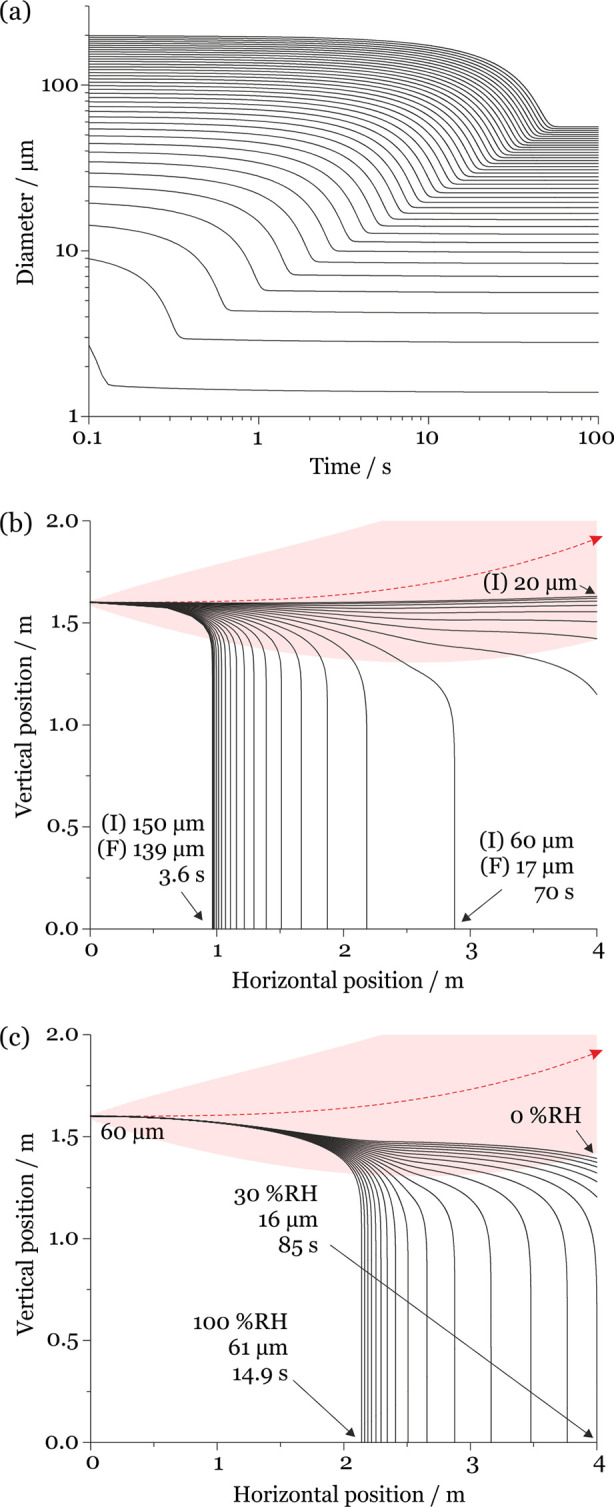
(a) Simulated evaporation time scales for saliva droplets evaporating at 293 K (20 °C) and 50% RH with initial diameters spanning 5–200 μm (5 μm intervals). (b) Comparison of the evaporation–sedimentation curves for saliva droplets 20–150 μm in initial diameter (5 μm intervals), projected by a cough at 10 m/s at 293 K and 50% RH. The trajectory of the respiratory jet is shown in red (traveling from left to right). (I) indicates the initial droplet size and (F) the size at deposition. (c) Dependence of sedimentation distance on RH for saliva droplets initially 60 μm in diameter generated by a cough at 10 m/s at 293 K and 0–100% RH (5% RH intervals). The trajectory of the respiratory jet is shown in red.