
Figure 3.
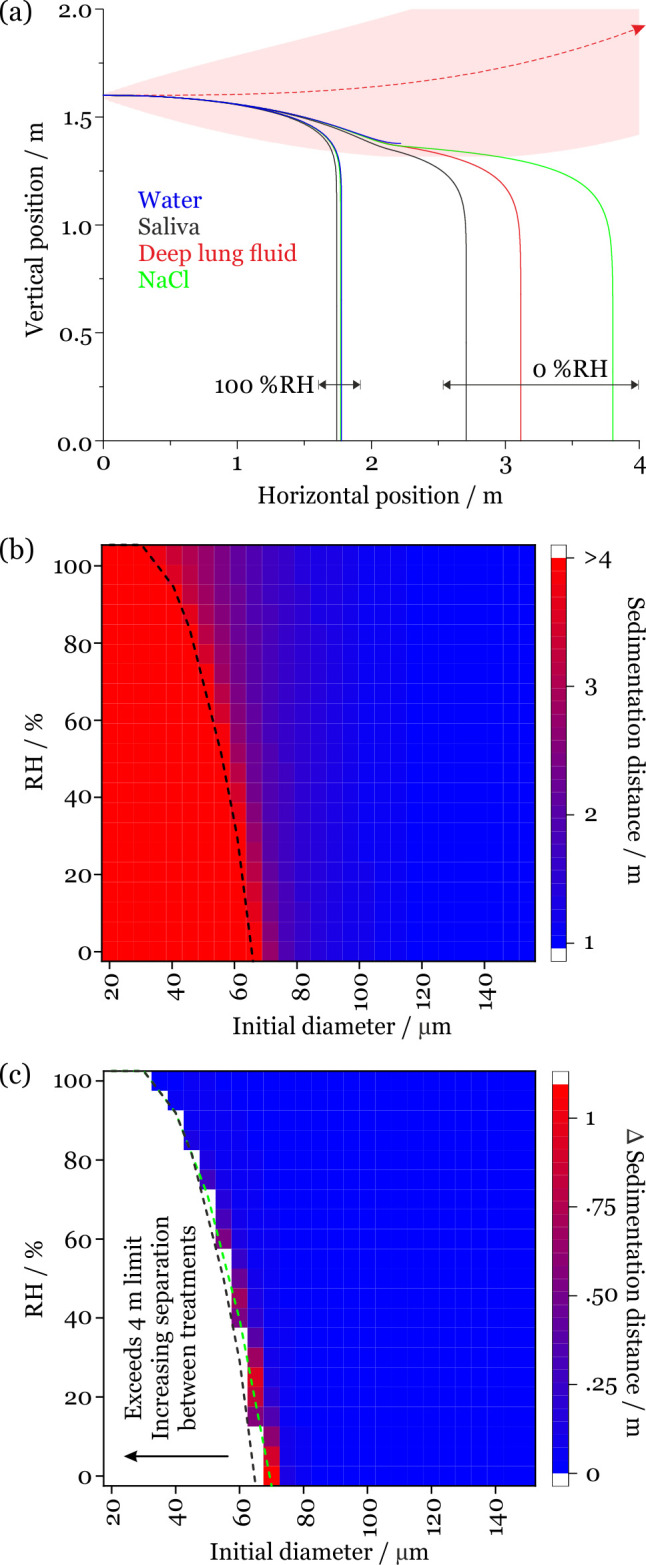
(a) Comparison of the sedimentation trajectories of droplets composed of saliva, lung fluid, sodium chloride, and pure water showing two limiting cases for droplets initially of the same size (70 μm). The trajectory of the respiratory jet is shown in red. (b) Sedimentation distance for saliva droplets projected from a cough at 10 m/s into an environment at 293 K (20 °C). The black dashed line indicates when the 4 m sedimentation limit is reached. (c) Change in sedimentation distance on assuming that the droplets are composed of sodium chloride solution rather than saliva. The dashed lines indicate when the 4 m sedimentation limit is reached for saliva (black) and NaCl (green).