
Figure 1.
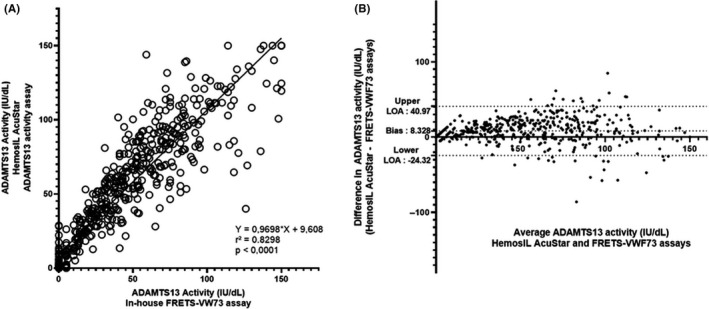
Scatter diagram (A) and Bland‐Altman plot (B) illustrating the comparison of in‐house FRETS‐VWF73 assay (reference method) and HemosIL AcuStar ADAMTS13 activity assay (evaluated method) for the measurement of ADAMTS13 activity in 539 plasma samples. With our in‐house FRETS‐VWF73 assay, 142 patients had an undetectable (<10 IU/dL) ADAMTS13 activity. Among those patients, 14 were found ≥ 10 IU/dL with the HemosIL AcuStar ADAMTS13 activity (false negative). Conversely, 397 patients had a detectable ADAMTS13 activity (≥10 IU/dL) with our in‐house FRETS‐VWF73, and only 1 had undetectable ADAMTS13 activity (< 10 IU/dL) as measured by the HemosIL AcuStar ADAMTS13 activity assay (false positive). For the statistical analysis, values were respectively set to 5 IU/dL and 0 IU/dL if ADAMTS13 activity was determined < 10 IU/dL with a detectable RFU and < 5 IU/dL with our in‐house FRETS‐VWF73. Each sample is represented as a circle. Pearson’s correlation coefficient (r 2) was found at .8298 (P < .0001), and fitted regression line was Y = 0.9698X + 9.608. The Bland‐Altman plot illustrates the comparison of the HemosIL AcuStar ADAMTS13 Activity assay to our in‐house FRETS‐VWF73. Each sample is represented by a dot. The Bland‐Altman plot reveals a mean bias at 8.328 IU/dL and quite large limits of agreement (−24.32 IU/dL; +40.97 IU/dL), indicating (i) a variability between both assays for the measurement of ADAMTS13 activity and (ii) an overall tendency of the HemosIL AcuStar ADAMTS13 Activity assay to overestimate results compared to our in‐house FRETS‐VWF73 assay