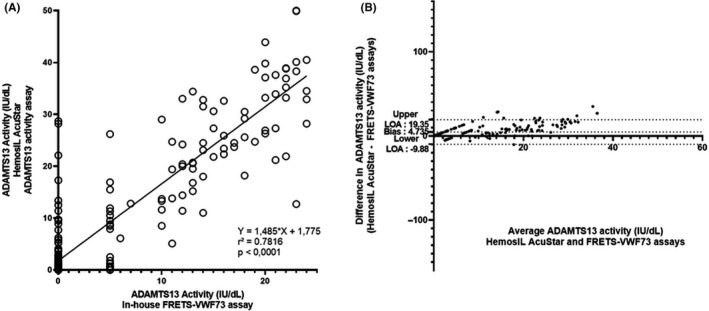
Figure 2.

Scatter diagram (A) and Bland‐Altman plot (B) illustrating the comparison of in‐house FRETS‐VWF73 assay (reference method) and HemosIL AcuStar ADAMTS13 activity assay (evaluated method) for the measurement of ADAMTS13 activity for 210 citrated plasma samples with ADAMTS13 activity < 25 IU/dL as assessed by in‐house FRETS‐VWF73 assay. For the statistical analysis, values were respectively set to 5 IU/dL and 0 IU/dL if ADAMTS13 activity was determined < 10 IU/dL with a detectable RFU and < 5 IU/dL with our in‐house FRETS‐VWF73 assay. Each sample is represented as a circle Pearson’s correlation coefficient (r 2) was found at .7816 (P < .0001), and fitted regression line was Y = 1.485X + 1.775. The Bland‐Altmann plot illustrates the comparison of the HemosIL AcuStar ADAMTS13 activity assay to our in‐house FRETS‐VWF73. Each sample is represented by a dot. The Bland‐Altman plot specifically targeting citrated plasmas with ADAMTS13 activity < 25 IU/dL assessed by our in‐house FRETS‐VWF73 assay reveals a lower mean bias, at 4.735 IU/dL, and narrower limits of agreement (−9.88 IU/dL; +19.35 IU/dL) compared to the analysis conducted on all plasmas (0‐150 IU/dL). This result suggests that (i) the variability is far less important between both assays in the measurement of ADAMTS13 activity in the 0‐25 IU/dL range; (ii) the HemosIL AcuStar ADAMTS13 Activity assay tends to overestimate results less compared to our in‐house FRETS‐VWF73 assay in the 0‐25 IU/dL range
