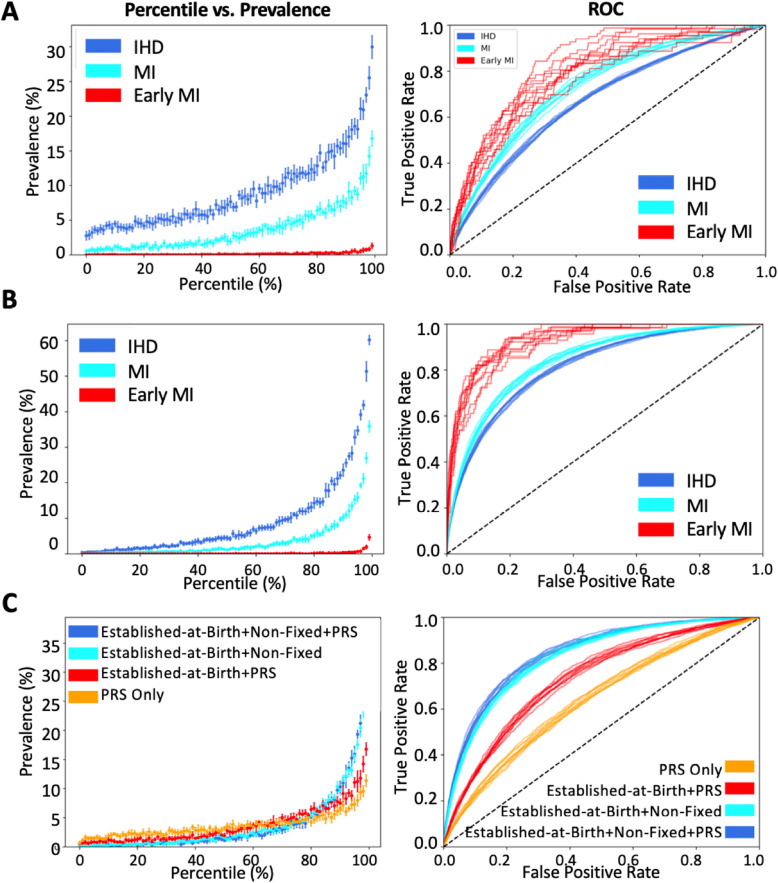
Fig. 2.
Modeling cardiovascular risk in the UKB with genetics and non-fixed factors. Panels on the left-hand side show the prevalence in the White British and Irish European UKB sample versus modeled risk percentile, for the 9% with ischemic heart disease (IHD, dark blue), approaching 5% who have had a myocardial infarction (MI, cyan), and 0.15% who had MI before the age of 50 (early MI, red). Panels on the right show receiver-operating curves of sensitivity against specificity. Each curve represents one of 10 cross-validated estimates, with point estimates plus standard deviation on the left. a 9-feature established-at-birth model. b 18-feature full-model. c Effect of adding features for MI prediction alone, yielding 4-feature, 9-feature, 14-feature, and 18-feature models as outlined in Fig. 1a

