Fig. 5.
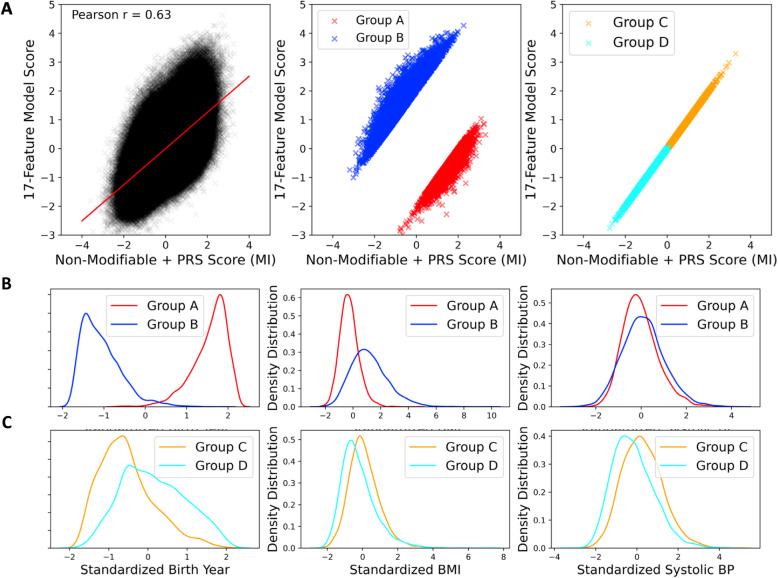
Comparison of MI Risk Scores with and without non-fixed risk factors. a Scatterplots of the full model (18-feature established-at-birth + non-fixed + PRS score) against the non-modifiable risk model (9-feature established-at-birth + PRS score). Individuals below the regression line (red, Group A in the middle panel) have comparatively lower predicted risk later in life compared to their predicted risk at birth, whereas those above the regression line (blue, Group B) have higher predicted risk of MI later in life; both groups represent the 2% extremes. The right -hand panel highlights individuals with relatively low risk according to both models (Group C, orange) or relatively high risk according to both models (cyan, Group D). b, c Standardized distributions of indicated non-fixed risk factors for the selected subsets of individuals, implying that high risk individuals are older and more overweight

