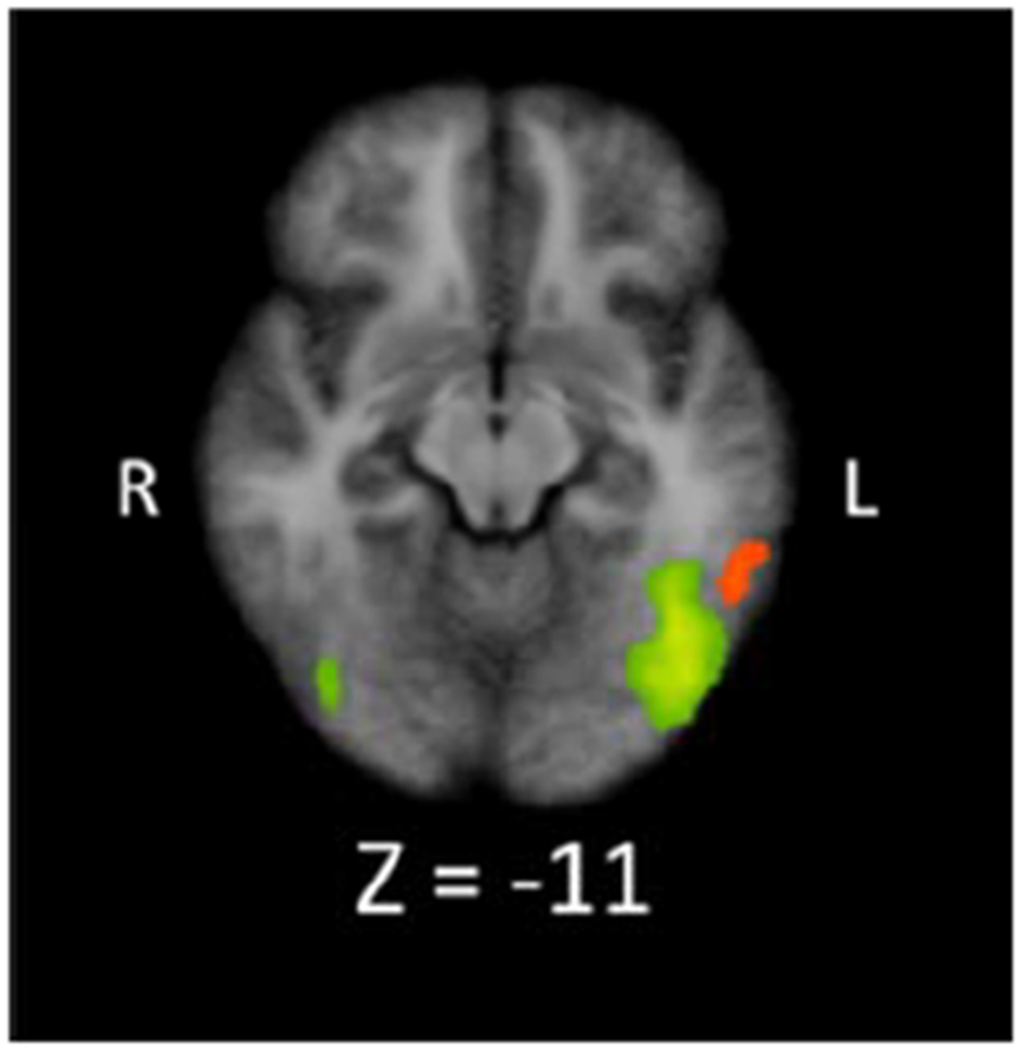
Figure 3.

Visual overlay of Digit Present > Digit Absent (orange) and Letter Present > Letter Absent (green) clusters in the ITG region, showing the spatial distinction between left ITG clusters related to digit and letter detection. The orange cluster is the same as cluster 3 in Figure 2, Panel (a). The green clusters are the same as cluster 1 (image right) and 4 (image left) from Figure 2, Panel (b). Note, colors are for distinguishing the two clusters and do not indicate differences in activation level.
