
Figure 9.
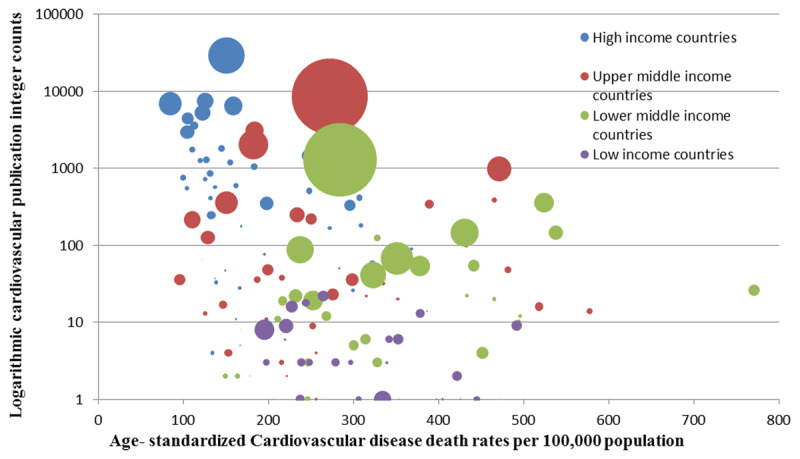
Logarithmic cardiovascular publication integer counts against age-standardized cardiovascular disease death rates per 100,000 population of for the year 2013.
Each bubble represents a country (n = 181). Size of the bubble represents the country population and color represents World Bank income group.