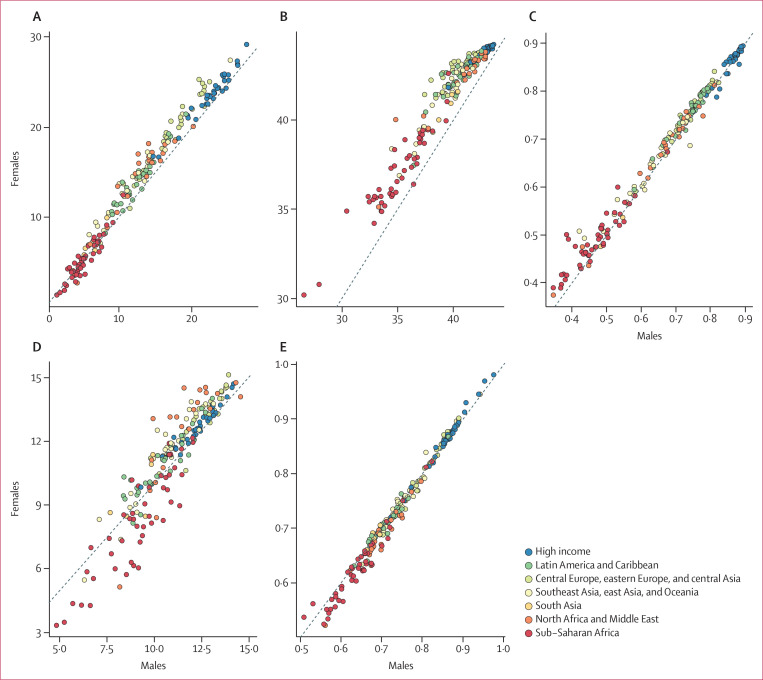
Figure 5.
Difference between men and women in expected human capital and for each of its four components, 2016
Countries categorised into regions according to the Global Burden of Disease super-regions. (A) Expected human capital. (B) Expected years lived, ages 20–64 years. (C) Functional health status. (D) Educational attainment. (E) Learning.

